
Click to Expand
Actions
- INMS_JN_2015-349_R000.txt
- INMS_JN_2015-349_R1017.txt
- INMS_LG_2015-349.txt
- INMS_MN_2015-349_R1017.txt
- INMS_MS_2015-349_R1017_D000_S001.txt
- INMS_MS_2015-349_R1017_D000_S002.txt
- INMS_MS_2015-349_R1017_D000_S003.txt
- INMS_MS_2015-349_R1017_D000_S004.txt
- INMS_MS_2015-349_R1017_D000_S005.txt
- INMS_MS_2015-349_R1017_D000_S006.txt
- INMS_MS_2015-349_R1017_D000_S007.txt
- INMS_MS_2015-349_R1017_D000_S008.txt
- INMS_MS_2015-349_R1017_D000_S009.txt
- INMS_MS_2015-349_R1017_D000_S010.txt
- INMS_MS_2015-349_R1017_D000_S011.txt
- INMS_MS_2015-349_R1017_D000_S012.txt
- INMS_MS_2015-349_R1017_D000_S013.txt
- INMS_MS_2015-349_R1017_D000_S014.txt
- INMS_MS_2015-349_R1017_D000_S015.txt
- INMS_MS_2015-349_R1017_D000_S016.txt
- INMS_MS_2015-349_R1017_D000_S017.txt
- INMS_MS_2015-349_R1017_D000_S018.txt
- INMS_MS_2015-349_R1017_D000_S019.txt
- INMS_MS_2015-349_R1017_D000_S020.txt
- INMS_MS_2015-349_R1017_D001_S021.txt
- INMS_MS_2015-349_R1017_D001_S022.txt
- INMS_MS_2015-349_R1017_D001_S023.txt
- INMS_MS_2015-349_R1017_D001_S024.txt
- INMS_MS_2015-349_R1017_D001_S025.txt
- INMS_MS_2015-349_R1017_D001_S026.txt
- INMS_MS_2015-349_R1017_D001_S027.txt
- INMS_MS_2015-349_R1017_D001_S028.txt
- INMS_MS_2015-349_R1017_D001_S029.txt
- INMS_MS_2015-349_R1017_D001_S030.txt
- INMS_MS_2015-349_R1017_D001_S031.txt
- INMS_MS_2015-349_R1017_D001_S032.txt
- INMS_MS_2015-349_R1017_D001_S033.txt
- INMS_MS_2015-349_R1017_D001_S034.txt
- INMS_MS_2015-349_R1017_D001_S035.txt
- INMS_MS_2015-349_R1017_D001_S036.txt
- INMS_MS_2015-349_R1017_D001_S037.txt
- INMS_MS_2015-349_R1017_D001_S038.txt
- INMS_MS_2015-349_R1017_D001_S039.txt
- INMS_MS_2015-349_R1017_D001_S040.txt
- INMS_MS_2015-349_R1017_D001_S041.txt
- INMS_MS_2015-349_R1017_D001_S042.txt
- INMS_MS_2015-349_R1017_D001_S043.txt
- INMS_MS_2015-349_R1017_D001_S044.txt
- INMS_MS_2015-349_R1017_D001_S045.txt
- INMS_MS_2015-349_R1017_D001_S046.txt
- INMS_MS_2015-349_R1017_D001_S047.txt
- INMS_MS_2015-349_R1017_D001_S048.txt
- INMS_MS_2015-349_R1017_D001_S049.txt
- INMS_MS_2015-349_R1017_D001_S050.txt
- INMS_MS_2015-349_R1017_D001_S051.txt
- INMS_MS_2015-349_R1017_D001_S052.txt
- INMS_MS_2015-349_R1017_D001_S053.txt
- INMS_MS_2015-349_R1017_D001_S054.txt
- INMS_MS_2015-349_R1017_D001_S055.txt
- INMS_MS_2015-349_R1017_D001_S056.txt
- INMS_MS_2015-349_R1017_D001_S057.txt
- INMS_MS_2015-349_R1017_D001_S058.txt
- INMS_MS_2015-349_R1017_D001_S059.txt
- INMS_MS_2015-349_R1017_D001_S060.txt
- INMS_MS_2015-349_R1017_D002_S061.txt
- INMS_MS_2015-349_R1017_D002_S062.txt
- INMS_MS_2015-349_R1017_D002_S063.txt
- INMS_MS_2015-349_R1017_D002_S064.txt
- INMS_MS_2015-349_R1017_D002_S065.txt
- INMS_MS_2015-349_R1017_D002_S066.txt
- INMS_MS_2015-349_R1017_D002_S067.txt
- INMS_MS_2015-349_R1017_D002_S068.txt
- INMS_MS_2015-349_R1017_D002_S069.txt
- INMS_MS_2015-349_R1017_D002_S070.txt
- INMS_MS_2015-349_R1017_D002_S071.txt
- INMS_MS_2015-349_R1017_D002_S072.txt
- INMS_MS_2015-349_R1017_D002_S073.txt
- INMS_MS_2015-349_R1017_D002_S074.txt
- INMS_MS_2015-349_R1017_D002_S075.txt
- INMS_MS_2015-349_R1017_D002_S076.txt
- INMS_MS_2015-349_R1017_D002_S077.txt
- INMS_MS_2015-349_R1017_D002_S078.txt
- INMS_MS_2015-349_R1017_D002_S079.txt
- INMS_MS_2015-349_R1017_D002_S080.txt
- INMS_MS_2015-349_R1017_D002_S081.txt
- INMS_MS_2015-349_R1017_D002_S082.txt
- INMS_MS_2015-349_R1017_D002_S083.txt
- INMS_MS_2015-349_R1017_D002_S084.txt
- INMS_MS_2015-349_R1017_D002_S085.txt
- INMS_MS_2015-349_R1017_D002_S086.txt
- INMS_MS_2015-349_R1017_D002_S087.txt
- INMS_MS_2015-349_R1017_D002_S088.txt
- INMS_MS_2015-349_R1017_D002_S089.txt
- INMS_MS_2015-349_R1017_D002_S090.txt
- INMS_MS_2015-349_R1017_D002_S091.txt
- INMS_MS_2015-349_R1017_D002_S092.txt
- INMS_MS_2015-349_R1017_D002_S093.txt
- INMS_MS_2015-349_R1017_D002_S094.txt
- INMS_MS_2015-349_R1017_D002_S095.txt
- INMS_MS_2015-349_R1017_D002_S096.txt
- INMS_MS_2015-349_R1017_D002_S097.txt
- INMS_MS_2015-349_R1017_D002_S098.txt
- INMS_MS_2015-349_R1017_D002_S099.txt
- INMS_MS_2015-349_R1017_D002_S100.txt
- INMS_MS_2015-349_R1017_D003_S101.txt
- INMS_MS_2015-349_R1017_D003_S102.txt
- INMS_MS_2015-349_R1017_D003_S103.txt
- INMS_MS_2015-349_R1017_D003_S104.txt
- INMS_MS_2015-349_R1017_D003_S105.txt
- INMS_MS_2015-349_R1017_D003_S106.txt
- INMS_MS_2015-349_R1017_D003_S107.txt
- INMS_MS_2015-349_R1017_D003_S108.txt
- INMS_MS_2015-349_R1017_D003_S109.txt
- INMS_MS_2015-349_R1017_D003_S110.txt
- INMS_MS_2015-349_R1017_D003_S111.txt
- INMS_MS_2015-349_R1017_D003_S112.txt
- INMS_MS_2015-349_R1017_D003_S113.txt
- INMS_MS_2015-349_R1017_D003_S114.txt
- INMS_MS_2015-349_R1017_D003_S115.txt
- INMS_MS_2015-349_R1017_D003_S116.txt
- INMS_MS_2015-349_R1017_D003_S117.txt
- INMS_MS_2015-349_R1017_D003_S118.txt
- INMS_MS_2015-349_R1017_D003_S119.txt
- INMS_MS_2015-349_R1017_D003_S120.txt
- INMS_MS_2015-349_R1017_D003_S121.txt
- INMS_MS_2015-349_R1017_D003_S122.txt
- INMS_MS_2015-349_R1017_D003_S123.txt
- INMS_MS_2015-349_R1017_D003_S124.txt
- INMS_MS_2015-349_R1017_D003_S125.txt
- INMS_MS_2015-349_R1017_D003_S126.txt
- INMS_MS_2015-349_R1017_D003_S127.txt
- INMS_MS_2015-349_R1017_D003_S128.txt
- INMS_MS_2015-349_R1017_D003_S129.txt
- INMS_MS_2015-349_R1017_D003_S130.txt
- INMS_MS_2015-349_R1017_D003_S131.txt
- INMS_MS_2015-349_R1017_D003_S132.txt
- INMS_MS_2015-349_R1017_D003_S133.txt
- INMS_MS_2015-349_R1017_D003_S134.txt
- INMS_MS_2015-349_R1017_D003_S135.txt
- INMS_MS_2015-349_R1017_D003_S136.txt
- INMS_MS_2015-349_R1017_D003_S137.txt
- INMS_MS_2015-349_R1017_D003_S138.txt
- INMS_MS_2015-349_R1017_D003_S139.txt
- INMS_MS_2015-349_R1017_D003_S140.txt
- INMS_MS_2015-349_R1017_D003_S141.txt
- INMS_MS_2015-349_R1017_D003_S142.txt
- INMS_MS_2015-349_R1017_D003_S143.txt
- INMS_MS_2015-349_R1017_D003_S144.txt
- INMS_MS_2015-349_R1017_D003_S145.txt
- INMS_MS_2015-349_R1017_D003_S146.txt
- INMS_MS_2015-349_R1017_D003_S147.txt
- INMS_MS_2015-349_R1017_D003_S148.txt
- INMS_MS_2015-349_R1017_D003_S149.txt
- INMS_MS_2015-349_R1017_D003_S150.txt
- INMS_MS_2015-349_R1017_D003_S151.txt
- INMS_MS_2015-349_R1017_D003_S152.txt
- INMS_MS_2015-349_R1017_D003_S153.txt
- INMS_MS_2015-349_R1017_D003_S154.txt
- INMS_MS_2015-349_R1017_D003_S155.txt
- INMS_MS_2015-349_R1017_D003_S156.txt
- INMS_MS_2015-349_R1017_D003_S157.txt
- INMS_MS_2015-349_R1017_D003_S158.txt
- INMS_MS_2015-349_R1017_D003_S159.txt
- INMS_MS_2015-349_R1017_D003_S160.txt
- INMS_MS_2015-349_R1017_D003_S161.txt
- INMS_MS_2015-349_R1017_D003_S162.txt
- INMS_MS_2015-349_R1017_D003_S163.txt
- INMS_MS_2015-349_R1017_D003_S164.txt
- INMS_MS_2015-349_R1017_D003_S165.txt
- INMS_MS_2015-349_R1017_D003_S166.txt
- INMS_MS_2015-349_R1017_D003_S167.txt
- INMS_MS_2015-349_R1017_D003_S168.txt
- INMS_MS_2015-349_R1017_D003_S169.txt
- INMS_MS_2015-349_R1017_D003_S170.txt
- INMS_MS_2015-349_R1017_D003_S171.txt
- INMS_MS_2015-349_R1017_D003_S172.txt
- INMS_MS_2015-349_R1017_D003_S173.txt
- INMS_MS_2015-349_R1017_D003_S174.txt
- INMS_MS_2015-349_R1017_D003_S175.txt
- INMS_MS_2015-349_R1017_D003_S176.txt
- INMS_MS_2015-349_R1017_D003_S177.txt
- INMS_MS_2015-349_R1017_D003_S178.txt
- INMS_MS_2015-349_R1017_D003_S179.txt
- INMS_MS_2015-349_R1017_D003_S180.txt
- INMS_MS_2015-349_R1017_D003_S181.txt
- INMS_MS_2015-349_R1017_D003_S182.txt
- INMS_MS_2015-349_R1017_D003_S183.txt
- INMS_MS_2015-349_R1017_D003_S184.txt
- INMS_MS_2015-349_R1017_D003_S185.txt
- INMS_MS_2015-349_R1017_D003_S186.txt
- INMS_MS_2015-349_R1017_D003_S187.txt
- INMS_MS_2015-349_R1017_D003_S188.txt
- INMS_MS_2015-349_R1017_D003_S189.txt
- INMS_MS_2015-349_R1017_D003_S190.txt
- INMS_MS_2015-349_R1017_D003_S191.txt
- INMS_MS_2015-349_R1017_D003_S192.txt
- INMS_MS_2015-349_R1017_D003_S193.txt
- INMS_MS_2015-349_R1017_D003_S194.txt
- INMS_MS_2015-349_R1017_D003_S195.txt
- INMS_MS_2015-349_R1017_D003_S196.txt
- INMS_MS_2015-349_R1017_D003_S197.txt
- INMS_MS_2015-349_R1017_D003_S198.txt
- INMS_MS_2015-349_R1017_D003_S199.txt
- INMS_MS_2015-349_R1017_D003_S200.txt
- INMS_MS_2015-349_R1017_D003_S201.txt
- INMS_MS_2015-349_R1017_D003_S202.txt
- INMS_MS_2015-349_R1017_D003_S203.txt
- INMS_MS_2015-349_R1017_D003_S204.txt
- INMS_MS_2015-349_R1017_D003_S205.txt
- INMS_MS_2015-349_R1017_D003_S206.txt
- INMS_MS_2015-349_R1017_D003_S207.txt
- INMS_MS_2015-349_R1017_D003_S208.txt
- INMS_MS_2015-349_R1017_D003_S209.txt
- INMS_MS_2015-349_R1017_D003_S210.txt
- INMS_MS_2015-349_R1017_D003_S211.txt
- INMS_MS_2015-349_R1017_D003_S212.txt
- INMS_MS_2015-349_R1017_D003_S213.txt
- INMS_MS_2015-349_R1017_D003_S214.txt
- INMS_MS_2015-349_R1017_D003_S215.txt
- INMS_MS_2015-349_R1017_D003_S216.txt
- INMS_MS_2015-349_R1017_D003_S217.txt
- INMS_MS_2015-349_R1017_D003_S218.txt
- INMS_MS_2015-349_R1017_D003_S219.txt
- INMS_MS_2015-349_R1017_D003_S220.txt
- INMS_MS_2015-349_R1017_D003_S221.txt
- INMS_MS_2015-349_R1017_D003_S222.txt
- INMS_MS_2015-349_R1017_D003_S223.txt
- INMS_MS_2015-349_R1017_D003_S224.txt
- INMS_MS_2015-349_R1017_D003_S225.txt
- INMS_MS_2015-349_R1017_D003_S226.txt
- INMS_MS_2015-349_R1017_D003_S227.txt
- INMS_MS_2015-349_R1017_D003_S228.txt
- INMS_MS_2015-349_R1017_D003_S229.txt
- INMS_MS_2015-349_R1017_D003_S230.txt
- INMS_MS_2015-349_R1017_D003_S231.txt
- INMS_MS_2015-349_R1017_D003_S232.txt
- INMS_MS_2015-349_R1017_D003_S233.txt
- INMS_MS_2015-349_R1017_D003_S234.txt
- INMS_MS_2015-349_R1017_D003_S235.txt
- INMS_MS_2015-349_R1017_D004_S236.txt
- INMS_MS_2015-349_R1017_D004_S237.txt
- INMS_MS_2015-349_R1017_D004_S238.txt
- INMS_MS_2015-349_R1017_D004_S239.txt
- INMS_MS_2015-349_R1017_D004_S240.txt
- INMS_MS_2015-349_R1017_D004_S241.txt
- INMS_MS_2015-349_R1017_D004_S242.txt
- INMS_MS_2015-349_R1017_D004_S243.txt
- INMS_MS_2015-349_R1017_D004_S244.txt
- INMS_MS_2015-349_R1017_D004_S245.txt
- INMS_MS_2015-349_R1017_D004_S246.txt
- INMS_MS_2015-349_R1017_D004_S247.txt
- INMS_MS_2015-349_R1017_D004_S248.txt
- INMS_MS_2015-349_R1017_D004_S249.txt
- INMS_MS_2015-349_R1017_D004_S250.txt
- INMS_MS_2015-349_R1017_D004_S251.txt
- INMS_MS_2015-349_R1017_D004_S252.txt
- INMS_MS_2015-349_R1017_D004_S253.txt
- INMS_MS_2015-349_R1017_D004_S254.txt
- INMS_MS_2015-349_R1017_D004_S255.txt
- INMS_MS_2015-349_R1017_D004_S256.txt
- INMS_MS_2015-349_R1017_D004_S257.txt
- INMS_MS_2015-349_R1017_D004_S258.txt
- INMS_MS_2015-349_R1017_D004_S259.txt
- INMS_MS_2015-349_R1017_D004_S260.txt
- INMS_MS_2015-349_R1017_D004_S261.txt
- INMS_MS_2015-349_R1017_D004_S262.txt
- INMS_MS_2015-349_R1017_D004_S263.txt
- INMS_MS_2015-349_R1017_D004_S264.txt
- INMS_MS_2015-349_R1017_D004_S265.txt
- INMS_MS_2015-349_R1017_D004_S266.txt
- INMS_MS_2015-349_R1017_D004_S267.txt
- INMS_MS_2015-349_R1017_D004_S268.txt
- INMS_MS_2015-349_R1017_D004_S269.txt
- INMS_MS_2015-349_R1017_D004_S270.txt
- INMS_MS_2015-349_R1017_D004_S271.txt
- INMS_MS_2015-349_R1017_D004_S272.txt
- INMS_MS_2015-349_R1017_D004_S273.txt
- INMS_MS_2015-349_R1017_D004_S274.txt
- INMS_MS_2015-349_R1017_D004_S275.txt
- INMS_MS_2015-349_R1017_D005_S276.txt
- INMS_MS_2015-349_R1017_D005_S277.txt
- INMS_MS_2015-349_R1017_D005_S278.txt
- INMS_MS_2015-349_R1017_D005_S279.txt
- INMS_MS_2015-349_R1017_D005_S280.txt
- INMS_MS_2015-349_R1017_D005_S281.txt
- INMS_MS_2015-349_R1017_D005_S282.txt
- INMS_MS_2015-349_R1017_D005_S283.txt
- INMS_MS_2015-349_R1017_D005_S284.txt
- INMS_MS_2015-349_R1017_D005_S285.txt
- INMS_MS_2015-349_R1017_D005_S286.txt
- INMS_MS_2015-349_R1017_D005_S287.txt
- INMS_MS_2015-349_R1017_D005_S288.txt
- INMS_MS_2015-349_R1017_D005_S289.txt
- INMS_MS_2015-349_R1017_D005_S290.txt
- INMS_MS_2015-349_R1017_D005_S291.txt
- INMS_MS_2015-349_R1017_D005_S292.txt
- INMS_MS_2015-349_R1017_D005_S293.txt
- INMS_MS_2015-349_R1017_D005_S294.txt
- INMS_MS_2015-349_R1017_D005_S295.txt
- INMS_MS_2015-349_R1017_D005_S296.txt
- INMS_MS_2015-349_R1017_D005_S297.txt
- INMS_MS_2015-349_R1017_D005_S298.txt
- INMS_MS_2015-349_R1017_D005_S299.txt
- INMS_MS_2015-349_R1017_D005_S300.txt
- INMS_MS_2015-349_R1017_D005_S301.txt
- INMS_MS_2015-349_R1017_D005_S302.txt
- INMS_MS_2015-349_R1017_D005_S303.txt
- INMS_MS_2015-349_R1017_D005_S304.txt
- INMS_MS_2015-349_R1017_D005_S305.txt
- INMS_MS_2015-349_R1017_D005_S306.txt
- INMS_MS_2015-349_R1017_D005_S307.txt
- INMS_MS_2015-349_R1017_D005_S308.txt
- INMS_MS_2015-349_R1017_D005_S309.txt
- INMS_MS_2015-349_R1017_D005_S310.txt
- INMS_MS_2015-349_R1017_D005_S311.txt
- INMS_MS_2015-349_R1017_D005_S312.txt
- INMS_MS_2015-349_R1017_D005_S313.txt
- INMS_MS_2015-349_R1017_D005_S314.txt
- INMS_MS_2015-349_R1017_D005_S315.txt
- INMS_JN_2015-352_R000.txt
- INMS_JN_2015-352_R1020.txt
- INMS_LG_2015-352.txt
- INMS_MN_2015-352_R1020.txt
- INMS_MS_2015-352_R1020_D000_S001.txt
- INMS_MS_2015-352_R1020_D000_S002.txt
- INMS_MS_2015-352_R1020_D000_S003.txt
- INMS_MS_2015-352_R1020_D000_S004.txt
- INMS_MS_2015-352_R1020_D000_S005.txt
- INMS_MS_2015-352_R1020_D000_S006.txt
- INMS_MS_2015-352_R1020_D000_S007.txt
- INMS_MS_2015-352_R1020_D000_S008.txt
- INMS_MS_2015-352_R1020_D000_S009.txt
- INMS_MS_2015-352_R1020_D000_S010.txt
- INMS_MS_2015-352_R1020_D000_S011.txt
- INMS_MS_2015-352_R1020_D000_S012.txt
- INMS_MS_2015-352_R1020_D000_S013.txt
- INMS_MS_2015-352_R1020_D000_S014.txt
- INMS_MS_2015-352_R1020_D000_S015.txt
- INMS_MS_2015-352_R1020_D000_S016.txt
- INMS_MS_2015-352_R1020_D000_S017.txt
- INMS_MS_2015-352_R1020_D000_S018.txt
- INMS_MS_2015-352_R1020_D000_S019.txt
- INMS_MS_2015-352_R1020_D000_S020.txt
- INMS_MS_2015-352_R1020_D000_S021.txt
- INMS_MS_2015-352_R1020_D000_S022.txt
- INMS_MS_2015-352_R1020_D000_S023.txt
- INMS_MS_2015-352_R1020_D000_S024.txt
- INMS_MS_2015-352_R1020_D000_S025.txt
- INMS_MS_2015-352_R1020_D000_S026.txt
- INMS_MS_2015-352_R1020_D000_S027.txt
- INMS_MS_2015-352_R1020_D000_S028.txt
- INMS_MS_2015-352_R1020_D000_S029.txt
- INMS_MS_2015-352_R1020_D000_S030.txt
- INMS_MS_2015-352_R1020_D000_S031.txt
- INMS_MS_2015-352_R1020_D000_S032.txt
- INMS_MS_2015-352_R1020_D000_S033.txt
- INMS_MS_2015-352_R1020_D000_S034.txt
- INMS_MS_2015-352_R1020_D000_S035.txt
- INMS_MS_2015-352_R1020_D000_S036.txt
- INMS_MS_2015-352_R1020_D000_S037.txt
- INMS_MS_2015-352_R1020_D000_S038.txt
- INMS_MS_2015-352_R1020_D000_S039.txt
- INMS_MS_2015-352_R1020_D000_S040.txt
- INMS_MS_2015-352_R1020_D000_S041.txt
- INMS_MS_2015-352_R1020_D000_S042.txt
- INMS_MS_2015-352_R1020_D000_S043.txt
- INMS_MS_2015-352_R1020_D000_S044.txt
- INMS_MS_2015-352_R1020_D000_S045.txt
- INMS_MS_2015-352_R1020_D000_S046.txt
- INMS_MS_2015-352_R1020_D000_S047.txt
- INMS_MS_2015-352_R1020_D000_S048.txt
- INMS_MS_2015-352_R1020_D000_S049.txt
- INMS_MS_2015-352_R1020_D000_S050.txt
- INMS_MS_2015-352_R1020_D000_S051.txt
- INMS_MS_2015-352_R1020_D000_S052.txt
- INMS_MS_2015-352_R1020_D000_S053.txt
- INMS_MS_2015-352_R1020_D000_S054.txt
- INMS_MS_2015-352_R1020_D000_S055.txt
- INMS_MS_2015-352_R1020_D000_S056.txt
- INMS_MS_2015-352_R1020_D000_S057.txt
- INMS_MS_2015-352_R1020_D000_S058.txt
- INMS_MS_2015-352_R1020_D000_S059.txt
- INMS_MS_2015-352_R1020_D000_S060.txt
- INMS_MS_2015-352_R1020_D000_S061.txt
- INMS_MS_2015-352_R1020_D000_S062.txt
- INMS_MS_2015-352_R1020_D000_S063.txt
- INMS_MS_2015-352_R1020_D000_S064.txt
- INMS_MS_2015-352_R1020_D000_S065.txt
- INMS_MS_2015-352_R1020_D000_S066.txt
- INMS_MS_2015-352_R1020_D000_S067.txt
- INMS_MS_2015-352_R1020_D000_S068.txt
- INMS_MS_2015-352_R1020_D000_S069.txt
- INMS_MS_2015-352_R1020_D000_S070.txt
- INMS_MS_2015-352_R1020_D000_S071.txt
- INMS_MS_2015-352_R1020_D000_S072.txt
- INMS_MS_2015-352_R1020_D000_S073.txt
- INMS_MS_2015-352_R1020_D000_S074.txt
- INMS_MS_2015-352_R1020_D000_S075.txt
- INMS_MS_2015-352_R1020_D000_S076.txt
- INMS_MS_2015-352_R1020_D000_S077.txt
- INMS_MS_2015-352_R1020_D000_S078.txt
- INMS_MS_2015-352_R1020_D000_S079.txt
- INMS_MS_2015-352_R1020_D000_S080.txt
- INMS_MS_2015-352_R1020_D000_S081.txt
- INMS_MS_2015-352_R1020_D000_S082.txt
- INMS_MS_2015-352_R1020_D000_S083.txt
- INMS_MS_2015-352_R1020_D000_S084.txt
- INMS_MS_2015-352_R1020_D000_S085.txt
- INMS_MS_2015-352_R1020_D000_S086.txt
- INMS_MS_2015-352_R1020_D000_S087.txt
- INMS_MS_2015-352_R1020_D000_S088.txt
- INMS_MS_2015-352_R1020_D000_S089.txt
- INMS_MS_2015-352_R1020_D000_S090.txt
- INMS_MS_2015-352_R1020_D000_S091.txt
- INMS_MS_2015-352_R1020_D000_S092.txt
- INMS_MS_2015-352_R1020_D000_S093.txt
- INMS_MS_2015-352_R1020_D000_S094.txt
- INMS_MS_2015-352_R1020_D000_S095.txt
- INMS_MS_2015-352_R1020_D000_S096.txt
- INMS_MS_2015-352_R1020_D000_S097.txt
- INMS_MS_2015-352_R1020_D001_S098.txt
- INMS_MS_2015-352_R1020_D001_S099.txt
- INMS_MS_2015-352_R1020_D001_S100.txt
- INMS_MS_2015-352_R1020_D001_S101.txt
- INMS_MS_2015-352_R1020_D001_S102.txt
- INMS_MS_2015-352_R1020_D001_S103.txt
- INMS_MS_2015-352_R1020_D001_S104.txt
- INMS_MS_2015-352_R1020_D001_S105.txt
- INMS_MS_2015-352_R1020_D001_S106.txt
- INMS_MS_2015-352_R1020_D001_S107.txt
- INMS_MS_2015-352_R1020_D001_S108.txt
- INMS_MS_2015-352_R1020_D001_S109.txt
- INMS_MS_2015-352_R1020_D001_S110.txt
- INMS_MS_2015-352_R1020_D001_S111.txt
- INMS_MS_2015-352_R1020_D001_S112.txt
- INMS_MS_2015-352_R1020_D001_S113.txt
- INMS_MS_2015-352_R1020_D001_S114.txt
- INMS_MS_2015-352_R1020_D001_S115.txt
- INMS_MS_2015-352_R1020_D001_S116.txt
- INMS_MS_2015-352_R1020_D001_S117.txt
- INMS_MS_2015-352_R1020_D001_S118.txt
- INMS_MS_2015-352_R1020_D001_S119.txt
- INMS_MS_2015-352_R1020_D001_S120.txt
- INMS_MS_2015-352_R1020_D001_S121.txt
- INMS_MS_2015-352_R1020_D001_S122.txt
- INMS_MS_2015-352_R1020_D001_S123.txt
- INMS_MS_2015-352_R1020_D001_S124.txt
- INMS_MS_2015-352_R1020_D001_S125.txt
- INMS_MS_2015-352_R1020_D001_S126.txt
- INMS_MS_2015-352_R1020_D001_S127.txt
- INMS_MS_2015-352_R1020_D001_S128.txt
- INMS_MS_2015-352_R1020_D001_S129.txt
- INMS_MS_2015-352_R1020_D001_S130.txt
- INMS_MS_2015-352_R1020_D001_S131.txt
- INMS_MS_2015-352_R1020_D001_S132.txt
- INMS_MS_2015-352_R1020_D001_S133.txt
- INMS_MS_2015-352_R1020_D001_S134.txt
- INMS_MS_2015-352_R1020_D001_S135.txt
- INMS_MS_2015-352_R1020_D001_S136.txt
- INMS_MS_2015-352_R1020_D001_S137.txt
- INMS_MS_2015-352_R1020_D002_S138.txt
- INMS_MS_2015-352_R1020_D002_S139.txt
- INMS_MS_2015-352_R1020_D002_S140.txt
- INMS_MS_2015-352_R1020_D002_S141.txt
- INMS_MS_2015-352_R1020_D002_S142.txt
- INMS_MS_2015-352_R1020_D002_S143.txt
- INMS_MS_2015-352_R1020_D002_S144.txt
- INMS_MS_2015-352_R1020_D002_S145.txt
- INMS_MS_2015-352_R1020_D002_S146.txt
- INMS_MS_2015-352_R1020_D002_S147.txt
- INMS_MS_2015-352_R1020_D002_S148.txt
- INMS_MS_2015-352_R1020_D002_S149.txt
- INMS_MS_2015-352_R1020_D002_S150.txt
- INMS_MS_2015-352_R1020_D002_S151.txt
- INMS_MS_2015-352_R1020_D002_S152.txt
- INMS_MS_2015-352_R1020_D002_S153.txt
- INMS_MS_2015-352_R1020_D002_S154.txt
- INMS_MS_2015-352_R1020_D002_S155.txt
- INMS_MS_2015-352_R1020_D002_S156.txt
- INMS_MS_2015-352_R1020_D002_S157.txt
- INMS_MS_2015-352_R1020_D002_S158.txt
- INMS_MS_2015-352_R1020_D002_S159.txt
- INMS_MS_2015-352_R1020_D002_S160.txt
- INMS_MS_2015-352_R1020_D002_S161.txt
- INMS_MS_2015-352_R1020_D002_S162.txt
- INMS_MS_2015-352_R1020_D002_S163.txt
- INMS_MS_2015-352_R1020_D002_S164.txt
- INMS_MS_2015-352_R1020_D002_S165.txt
- INMS_MS_2015-352_R1020_D002_S166.txt
- INMS_MS_2015-352_R1020_D002_S167.txt
- INMS_MS_2015-352_R1020_D002_S168.txt
- INMS_MS_2015-352_R1020_D002_S169.txt
- INMS_MS_2015-352_R1020_D002_S170.txt
- INMS_MS_2015-352_R1020_D002_S171.txt
- INMS_MS_2015-352_R1020_D002_S172.txt
- INMS_MS_2015-352_R1020_D002_S173.txt
- INMS_MS_2015-352_R1020_D002_S174.txt
- INMS_MS_2015-352_R1020_D002_S175.txt
- INMS_MS_2015-352_R1020_D002_S176.txt
- INMS_MS_2015-352_R1020_D002_S177.txt
- INMS_MS_2015-352_R1020_D003_S178.txt
- INMS_MS_2015-352_R1020_D003_S179.txt
- INMS_MS_2015-352_R1020_D003_S180.txt
- INMS_MS_2015-352_R1020_D003_S181.txt
- INMS_MS_2015-352_R1020_D003_S182.txt
- INMS_MS_2015-352_R1020_D003_S183.txt
- INMS_MS_2015-352_R1020_D003_S184.txt
- INMS_MS_2015-352_R1020_D003_S185.txt
- INMS_MS_2015-352_R1020_D003_S186.txt
- INMS_MS_2015-352_R1020_D003_S187.txt
- INMS_MS_2015-352_R1020_D003_S188.txt
- INMS_MS_2015-352_R1020_D003_S189.txt
- INMS_MS_2015-352_R1020_D003_S190.txt
- INMS_MS_2015-352_R1020_D003_S191.txt
- INMS_MS_2015-352_R1020_D003_S192.txt
- INMS_MS_2015-352_R1020_D003_S193.txt
- INMS_MS_2015-352_R1020_D003_S194.txt
- INMS_MS_2015-352_R1020_D003_S195.txt
- INMS_MS_2015-352_R1020_D003_S196.txt
- INMS_MS_2015-352_R1020_D003_S197.txt
- INMS_MS_2015-352_R1020_D003_S198.txt
- INMS_MS_2015-352_R1020_D003_S199.txt
- INMS_MS_2015-352_R1020_D003_S200.txt
- INMS_MS_2015-352_R1020_D003_S201.txt
- INMS_MS_2015-352_R1020_D003_S202.txt
- INMS_MS_2015-352_R1020_D003_S203.txt
- INMS_MS_2015-352_R1020_D003_S204.txt
- INMS_MS_2015-352_R1020_D003_S205.txt
- INMS_MS_2015-352_R1020_D003_S206.txt
- INMS_MS_2015-352_R1020_D003_S207.txt
- INMS_MS_2015-352_R1020_D003_S208.txt
- INMS_MS_2015-352_R1020_D003_S209.txt
- INMS_MS_2015-352_R1020_D003_S210.txt
- INMS_MS_2015-352_R1020_D003_S211.txt
- INMS_MS_2015-352_R1020_D003_S212.txt
- INMS_MS_2015-352_R1020_D003_S213.txt
- INMS_MS_2015-352_R1020_D003_S214.txt
- INMS_MS_2015-352_R1020_D003_S215.txt
- INMS_MS_2015-352_R1020_D003_S216.txt
- INMS_MS_2015-352_R1020_D003_S217.txt
- INMS_MS_2015-352_R1020_D004_S218.txt
- INMS_MS_2015-352_R1020_D004_S219.txt
- INMS_MS_2015-352_R1020_D004_S220.txt
- INMS_MS_2015-352_R1020_D004_S221.txt
- INMS_MS_2015-352_R1020_D004_S222.txt
- INMS_MS_2015-352_R1020_D004_S223.txt
- INMS_MS_2015-352_R1020_D004_S224.txt
- INMS_MS_2015-352_R1020_D004_S225.txt
- INMS_MS_2015-352_R1020_D004_S226.txt
- INMS_MS_2015-352_R1020_D004_S227.txt
- INMS_MS_2015-352_R1020_D004_S228.txt
- INMS_MS_2015-352_R1020_D004_S229.txt
- INMS_MS_2015-352_R1020_D004_S230.txt
- INMS_MS_2015-352_R1020_D004_S231.txt
- INMS_MS_2015-352_R1020_D004_S232.txt
- INMS_MS_2015-352_R1020_D004_S233.txt
- INMS_MS_2015-352_R1020_D004_S234.txt
- INMS_MS_2015-352_R1020_D004_S235.txt
- INMS_MS_2015-352_R1020_D004_S236.txt
- INMS_MS_2015-352_R1020_D004_S237.txt
- INMS_MS_2015-352_R1020_D004_S238.txt
- INMS_MS_2015-352_R1020_D004_S239.txt
- INMS_MS_2015-352_R1020_D004_S240.txt
- INMS_MS_2015-352_R1020_D004_S241.txt
- INMS_MS_2015-352_R1020_D004_S242.txt
- INMS_MS_2015-352_R1020_D004_S243.txt
- INMS_MS_2015-352_R1020_D004_S244.txt
- INMS_MS_2015-352_R1020_D004_S245.txt
- INMS_MS_2015-352_R1020_D004_S246.txt
- INMS_MS_2015-352_R1020_D004_S247.txt
- INMS_MS_2015-352_R1020_D004_S248.txt
- INMS_MS_2015-352_R1020_D004_S249.txt
- INMS_MS_2015-352_R1020_D004_S250.txt
- INMS_MS_2015-352_R1020_D004_S251.txt
- INMS_MS_2015-352_R1020_D004_S252.txt
- INMS_MS_2015-352_R1020_D004_S253.txt
- INMS_MS_2015-352_R1020_D004_S254.txt
- INMS_MS_2015-352_R1020_D004_S255.txt
- INMS_MS_2015-352_R1020_D004_S256.txt
- INMS_MS_2015-352_R1020_D004_S257.txt
- INMS_MS_2015-352_R1020_D005_S258.txt
- INMS_MS_2015-352_R1020_D005_S259.txt
- INMS_MS_2015-352_R1020_D005_S260.txt
- INMS_MS_2015-352_R1020_D005_S261.txt
- INMS_MS_2015-352_R1020_D005_S262.txt
- INMS_MS_2015-352_R1020_D005_S263.txt
- INMS_MS_2015-352_R1020_D005_S264.txt
- INMS_MS_2015-352_R1020_D005_S265.txt
- INMS_MS_2015-352_R1020_D005_S266.txt
- INMS_MS_2015-352_R1020_D005_S267.txt
- INMS_MS_2015-352_R1020_D005_S268.txt
- INMS_MS_2015-352_R1020_D005_S269.txt
- INMS_MS_2015-352_R1020_D005_S270.txt
- INMS_MS_2015-352_R1020_D005_S271.txt
- INMS_MS_2015-352_R1020_D005_S272.txt
- INMS_MS_2015-352_R1020_D005_S273.txt
- INMS_MS_2015-352_R1020_D005_S274.txt
- INMS_MS_2015-352_R1020_D005_S275.txt
- INMS_MS_2015-352_R1020_D005_S276.txt
- INMS_MS_2015-352_R1020_D005_S277.txt
- INMS_MS_2015-352_R1020_D005_S278.txt
- INMS_MS_2015-352_R1020_D005_S279.txt
- INMS_MS_2015-352_R1020_D005_S280.txt
- INMS_MS_2015-352_R1020_D005_S281.txt
- INMS_MS_2015-352_R1020_D005_S282.txt
- INMS_MS_2015-352_R1020_D005_S283.txt
- INMS_MS_2015-352_R1020_D005_S284.txt
- INMS_MS_2015-352_R1020_D005_S285.txt
- INMS_MS_2015-352_R1020_D005_S286.txt
- INMS_MS_2015-352_R1020_D005_S287.txt
- INMS_MS_2015-352_R1020_D005_S288.txt
- INMS_MS_2015-352_R1020_D005_S289.txt
- INMS_MS_2015-352_R1020_D005_S290.txt
- INMS_MS_2015-352_R1020_D005_S291.txt
- INMS_MS_2015-352_R1020_D005_S292.txt
- INMS_MS_2015-352_R1020_D005_S293.txt
- INMS_MS_2015-352_R1020_D005_S294.txt
- INMS_MS_2015-352_R1020_D005_S295.txt
- INMS_MS_2015-352_R1020_D005_S296.txt
- INMS_MS_2015-352_R1020_D005_S297.txt
- INMS_MS_2015-352_R1020_D006_S298.txt
- INMS_MS_2015-352_R1020_D006_S299.txt
- INMS_MS_2015-352_R1020_D006_S300.txt
- INMS_MS_2015-352_R1020_D006_S301.txt
- INMS_MS_2015-352_R1020_D006_S302.txt
- INMS_MS_2015-352_R1020_D006_S303.txt
- INMS_MS_2015-352_R1020_D006_S304.txt
- INMS_MS_2015-352_R1020_D006_S305.txt
- INMS_MS_2015-352_R1020_D006_S306.txt
- INMS_MS_2015-352_R1020_D006_S307.txt
- INMS_MS_2015-352_R1020_D006_S308.txt
- INMS_MS_2015-352_R1020_D006_S309.txt
- INMS_MS_2015-352_R1020_D006_S310.txt
- INMS_MS_2015-352_R1020_D006_S311.txt
- INMS_MS_2015-352_R1020_D006_S312.txt
- INMS_MS_2015-352_R1020_D006_S313.txt
- INMS_MS_2015-352_R1020_D006_S314.txt
- INMS_MS_2015-352_R1020_D006_S315.txt
- INMS_MS_2015-352_R1020_D006_S316.txt
- INMS_MS_2015-352_R1020_D006_S317.txt
- INMS_MS_2015-352_R1020_D006_S318.txt
- INMS_MS_2015-352_R1020_D006_S319.txt
- INMS_MS_2015-352_R1020_D006_S320.txt
- INMS_MS_2015-352_R1020_D006_S321.txt
- INMS_MS_2015-352_R1020_D006_S322.txt
- INMS_MS_2015-352_R1020_D006_S323.txt
- INMS_MS_2015-352_R1020_D006_S324.txt
- INMS_MS_2015-352_R1020_D006_S325.txt
- INMS_MS_2015-352_R1020_D006_S326.txt
- INMS_MS_2015-352_R1020_D006_S327.txt
- INMS_MS_2015-352_R1020_D006_S328.txt
- INMS_MS_2015-352_R1020_D006_S329.txt
- INMS_MS_2015-352_R1020_D006_S330.txt
- INMS_MS_2015-352_R1020_D006_S331.txt
- INMS_MS_2015-352_R1020_D006_S332.txt
- INMS_MS_2015-352_R1020_D006_S333.txt
- INMS_MS_2015-352_R1020_D006_S334.txt
- INMS_MS_2015-352_R1020_D006_S335.txt
- INMS_MS_2015-352_R1020_D006_S336.txt
- INMS_MS_2015-352_R1020_D006_S337.txt
- INMS_JN_2015-356_R1021.txt
- INMS_LG_2015-356.txt
- INMS_MN_2015-356_R1021.txt
- INMS_MS_2015-356_R1021_D001_S001.txt
- INMS_MS_2015-356_R1021_D001_S002.txt
- INMS_MS_2015-356_R1021_D001_S003.txt
- INMS_MS_2015-356_R1021_D001_S004.txt
- INMS_MS_2015-356_R1021_D001_S005.txt
- INMS_MS_2015-356_R1021_D001_S006.txt
- INMS_MS_2015-356_R1021_D001_S007.txt
- INMS_MS_2015-356_R1021_D001_S008.txt
- INMS_MS_2015-356_R1021_D001_S009.txt
- INMS_MS_2015-356_R1021_D001_S010.txt
- INMS_MS_2015-356_R1021_D001_S011.txt
- INMS_MS_2015-356_R1021_D001_S012.txt
- INMS_MS_2015-356_R1021_D001_S013.txt
- INMS_MS_2015-356_R1021_D001_S014.txt
- INMS_MS_2015-356_R1021_D001_S015.txt
- INMS_MS_2015-356_R1021_D001_S016.txt
- INMS_MS_2015-356_R1021_D001_S017.txt
- INMS_MS_2015-356_R1021_D001_S018.txt
- INMS_MS_2015-356_R1021_D001_S019.txt
- INMS_MS_2015-356_R1021_D001_S020.txt
- INMS_MS_2015-356_R1021_D001_S021.txt
- INMS_MS_2015-356_R1021_D001_S022.txt
- INMS_MS_2015-356_R1021_D001_S023.txt
- INMS_MS_2015-356_R1021_D001_S024.txt
- INMS_MS_2015-356_R1021_D001_S025.txt
- INMS_MS_2015-356_R1021_D001_S026.txt
- INMS_MS_2015-356_R1021_D001_S027.txt
- INMS_MS_2015-356_R1021_D001_S028.txt
- INMS_MS_2015-356_R1021_D001_S029.txt
- INMS_MS_2015-356_R1021_D001_S030.txt
- INMS_MS_2015-356_R1021_D001_S031.txt
- INMS_MS_2015-356_R1021_D001_S032.txt
- INMS_MS_2015-356_R1021_D001_S033.txt
- INMS_MS_2015-356_R1021_D001_S034.txt
- INMS_MS_2015-356_R1021_D001_S035.txt
- INMS_MS_2015-356_R1021_D001_S036.txt
- INMS_MS_2015-356_R1021_D001_S037.txt
- INMS_MS_2015-356_R1021_D001_S038.txt
- INMS_MS_2015-356_R1021_D001_S039.txt
- INMS_MS_2015-356_R1021_D001_S040.txt
- INMS_MS_2015-356_R1021_D002_S041.txt
- INMS_MS_2015-356_R1021_D002_S042.txt
- INMS_MS_2015-356_R1021_D002_S043.txt
- INMS_MS_2015-356_R1021_D002_S044.txt
- INMS_MS_2015-356_R1021_D002_S045.txt
- INMS_MS_2015-356_R1021_D002_S046.txt
- INMS_MS_2015-356_R1021_D002_S047.txt
- INMS_MS_2015-356_R1021_D002_S048.txt
- INMS_MS_2015-356_R1021_D002_S049.txt
- INMS_MS_2015-356_R1021_D002_S050.txt
- INMS_MS_2015-356_R1021_D002_S051.txt
- INMS_MS_2015-356_R1021_D002_S052.txt
- INMS_MS_2015-356_R1021_D002_S053.txt
- INMS_MS_2015-356_R1021_D002_S054.txt
- INMS_MS_2015-356_R1021_D002_S055.txt
- INMS_MS_2015-356_R1021_D002_S056.txt
- INMS_MS_2015-356_R1021_D002_S057.txt
- INMS_MS_2015-356_R1021_D002_S058.txt
- INMS_MS_2015-356_R1021_D002_S059.txt
- INMS_MS_2015-356_R1021_D002_S060.txt
- INMS_MS_2015-356_R1021_D002_S061.txt
- INMS_MS_2015-356_R1021_D002_S062.txt
- INMS_MS_2015-356_R1021_D002_S063.txt
- INMS_MS_2015-356_R1021_D002_S064.txt
- INMS_MS_2015-356_R1021_D002_S065.txt
- INMS_MS_2015-356_R1021_D002_S066.txt
- INMS_MS_2015-356_R1021_D002_S067.txt
- INMS_MS_2015-356_R1021_D002_S068.txt
- INMS_MS_2015-356_R1021_D002_S069.txt
- INMS_MS_2015-356_R1021_D002_S070.txt
- INMS_MS_2015-356_R1021_D002_S071.txt
- INMS_MS_2015-356_R1021_D002_S072.txt
- INMS_MS_2015-356_R1021_D002_S073.txt
- INMS_MS_2015-356_R1021_D002_S074.txt
- INMS_MS_2015-356_R1021_D002_S075.txt
- INMS_MS_2015-356_R1021_D002_S076.txt
- INMS_MS_2015-356_R1021_D002_S077.txt
- INMS_MS_2015-356_R1021_D002_S078.txt
- INMS_MS_2015-356_R1021_D002_S079.txt
- INMS_MS_2015-356_R1021_D002_S080.txt
- INMS_MS_2015-356_R1021_D003_S081.txt
- INMS_MS_2015-356_R1021_D003_S082.txt
- INMS_MS_2015-356_R1021_D003_S083.txt
- INMS_MS_2015-356_R1021_D003_S084.txt
- INMS_MS_2015-356_R1021_D003_S085.txt
- INMS_MS_2015-356_R1021_D003_S086.txt
- INMS_MS_2015-356_R1021_D003_S087.txt
- INMS_MS_2015-356_R1021_D003_S088.txt
- INMS_MS_2015-356_R1021_D003_S089.txt
- INMS_MS_2015-356_R1021_D003_S090.txt
- INMS_MS_2015-356_R1021_D003_S091.txt
- INMS_MS_2015-356_R1021_D003_S092.txt
- INMS_MS_2015-356_R1021_D003_S093.txt
- INMS_MS_2015-356_R1021_D003_S094.txt
- INMS_MS_2015-356_R1021_D003_S095.txt
- INMS_MS_2015-356_R1021_D003_S096.txt
- INMS_MS_2015-356_R1021_D003_S097.txt
- INMS_MS_2015-356_R1021_D003_S098.txt
- INMS_MS_2015-356_R1021_D003_S099.txt
- INMS_MS_2015-356_R1021_D003_S100.txt
- INMS_MS_2015-356_R1021_D003_S101.txt
- INMS_MS_2015-356_R1021_D003_S102.txt
- INMS_MS_2015-356_R1021_D003_S103.txt
- INMS_MS_2015-356_R1021_D003_S104.txt
- INMS_MS_2015-356_R1021_D003_S105.txt
- INMS_MS_2015-356_R1021_D003_S106.txt
- INMS_MS_2015-356_R1021_D003_S107.txt
- INMS_MS_2015-356_R1021_D003_S108.txt
- INMS_MS_2015-356_R1021_D003_S109.txt
- INMS_MS_2015-356_R1021_D003_S110.txt
- INMS_MS_2015-356_R1021_D003_S111.txt
- INMS_MS_2015-356_R1021_D003_S112.txt
- INMS_MS_2015-356_R1021_D003_S113.txt
- INMS_MS_2015-356_R1021_D003_S114.txt
- INMS_MS_2015-356_R1021_D003_S115.txt
- INMS_MS_2015-356_R1021_D003_S116.txt
- INMS_MS_2015-356_R1021_D003_S117.txt
- INMS_MS_2015-356_R1021_D003_S118.txt
- INMS_MS_2015-356_R1021_D003_S119.txt
- INMS_MS_2015-356_R1021_D003_S120.txt
- INMS_MS_2015-356_R1021_D004_S121.txt
- INMS_MS_2015-356_R1021_D004_S122.txt
- INMS_MS_2015-356_R1021_D004_S123.txt
- INMS_MS_2015-356_R1021_D004_S124.txt
- INMS_MS_2015-356_R1021_D004_S125.txt
- INMS_MS_2015-356_R1021_D004_S126.txt
- INMS_MS_2015-356_R1021_D004_S127.txt
- INMS_MS_2015-356_R1021_D004_S128.txt
- INMS_MS_2015-356_R1021_D004_S129.txt
- INMS_MS_2015-356_R1021_D004_S130.txt
- INMS_MS_2015-356_R1021_D004_S131.txt
- INMS_MS_2015-356_R1021_D004_S132.txt
- INMS_MS_2015-356_R1021_D004_S133.txt
- INMS_MS_2015-356_R1021_D004_S134.txt
- INMS_MS_2015-356_R1021_D004_S135.txt
- INMS_MS_2015-356_R1021_D004_S136.txt
- INMS_MS_2015-356_R1021_D004_S137.txt
- INMS_MS_2015-356_R1021_D004_S138.txt
- INMS_MS_2015-356_R1021_D004_S139.txt
- INMS_MS_2015-356_R1021_D004_S140.txt
- INMS_MS_2015-356_R1021_D004_S141.txt
- INMS_MS_2015-356_R1021_D004_S142.txt
- INMS_MS_2015-356_R1021_D004_S143.txt
- INMS_MS_2015-356_R1021_D004_S144.txt
- INMS_MS_2015-356_R1021_D004_S145.txt
- INMS_MS_2015-356_R1021_D004_S146.txt
- INMS_MS_2015-356_R1021_D004_S147.txt
- INMS_MS_2015-356_R1021_D004_S148.txt
- INMS_MS_2015-356_R1021_D004_S149.txt
- INMS_MS_2015-356_R1021_D004_S150.txt
- INMS_MS_2015-356_R1021_D004_S151.txt
- INMS_MS_2015-356_R1021_D004_S152.txt
- INMS_MS_2015-356_R1021_D004_S153.txt
- INMS_MS_2015-356_R1021_D004_S154.txt
- INMS_MS_2015-356_R1021_D004_S155.txt
- INMS_MS_2015-356_R1021_D004_S156.txt
- INMS_MS_2015-356_R1021_D004_S157.txt
- INMS_MS_2015-356_R1021_D004_S158.txt
- INMS_MS_2015-356_R1021_D004_S159.txt
- INMS_MS_2015-356_R1021_D004_S160.txt
- INMS_MS_2015-356_R1021_D005_S161.txt
- INMS_MS_2015-356_R1021_D005_S162.txt
- INMS_MS_2015-356_R1021_D005_S163.txt
- INMS_MS_2015-356_R1021_D005_S164.txt
- INMS_MS_2015-356_R1021_D005_S165.txt
- INMS_MS_2015-356_R1021_D005_S166.txt
- INMS_MS_2015-356_R1021_D005_S167.txt
- INMS_MS_2015-356_R1021_D005_S168.txt
- INMS_MS_2015-356_R1021_D005_S169.txt
- INMS_MS_2015-356_R1021_D005_S170.txt
- INMS_MS_2015-356_R1021_D005_S171.txt
- INMS_MS_2015-356_R1021_D005_S172.txt
- INMS_MS_2015-356_R1021_D005_S173.txt
- INMS_MS_2015-356_R1021_D005_S174.txt
- INMS_MS_2015-356_R1021_D005_S175.txt
- INMS_MS_2015-356_R1021_D005_S176.txt
- INMS_MS_2015-356_R1021_D005_S177.txt
- INMS_MS_2015-356_R1021_D005_S178.txt
- INMS_MS_2015-356_R1021_D005_S179.txt
- INMS_MS_2015-356_R1021_D005_S180.txt
- INMS_MS_2015-356_R1021_D005_S181.txt
- INMS_MS_2015-356_R1021_D005_S182.txt
- INMS_MS_2015-356_R1021_D005_S183.txt
- INMS_MS_2015-356_R1021_D005_S184.txt
- INMS_MS_2015-356_R1021_D005_S185.txt
- INMS_MS_2015-356_R1021_D005_S186.txt
- INMS_MS_2015-356_R1021_D005_S187.txt
- INMS_MS_2015-356_R1021_D005_S188.txt
- INMS_MS_2015-356_R1021_D005_S189.txt
- INMS_MS_2015-356_R1021_D005_S190.txt
- INMS_MS_2015-356_R1021_D005_S191.txt
- INMS_MS_2015-356_R1021_D005_S192.txt
- INMS_MS_2015-356_R1021_D005_S193.txt
- INMS_MS_2015-356_R1021_D005_S194.txt
- INMS_MS_2015-356_R1021_D005_S195.txt
- INMS_MS_2015-356_R1021_D005_S196.txt
- INMS_MS_2015-356_R1021_D005_S197.txt
- INMS_MS_2015-356_R1021_D005_S198.txt
- INMS_MS_2015-356_R1021_D005_S199.txt
- INMS_MS_2015-356_R1021_D005_S200.txt
- INMS_JN_2016-015_R000.txt
- INMS_JN_2016-015_R1023.txt
- INMS_LG_2016-015.txt
- INMS_MN_2016-015_R1022.txt
- INMS_MN_2016-015_R1023.txt
- INMS_MS_2016-015_R1023_D001_S001.txt
- INMS_MS_2016-015_R1023_D001_S002.txt
- INMS_MS_2016-015_R1023_D001_S003.txt
- INMS_MS_2016-015_R1023_D001_S004.txt
- INMS_MS_2016-015_R1023_D001_S005.txt
- INMS_MS_2016-015_R1023_D001_S006.txt
- INMS_MS_2016-015_R1023_D001_S007.txt
- INMS_MS_2016-015_R1023_D001_S008.txt
- INMS_MS_2016-015_R1023_D001_S009.txt
- INMS_MS_2016-015_R1023_D001_S010.txt
- INMS_MS_2016-015_R1023_D001_S011.txt
- INMS_MS_2016-015_R1023_D001_S012.txt
- INMS_MS_2016-015_R1023_D001_S013.txt
- INMS_MS_2016-015_R1023_D001_S014.txt
- INMS_MS_2016-015_R1023_D001_S015.txt
- INMS_MS_2016-015_R1023_D001_S016.txt
- INMS_MS_2016-015_R1023_D001_S017.txt
- INMS_MS_2016-015_R1023_D001_S018.txt
- INMS_MS_2016-015_R1023_D001_S019.txt
- INMS_MS_2016-015_R1023_D001_S020.txt
- INMS_MS_2016-015_R1023_D001_S021.txt
- INMS_MS_2016-015_R1023_D001_S022.txt
- INMS_MS_2016-015_R1023_D001_S023.txt
- INMS_MS_2016-015_R1023_D001_S024.txt
- INMS_MS_2016-015_R1023_D001_S025.txt
- INMS_MS_2016-015_R1023_D001_S026.txt
- INMS_MS_2016-015_R1023_D001_S027.txt
- INMS_MS_2016-015_R1023_D001_S028.txt
- INMS_MS_2016-015_R1023_D001_S029.txt
- INMS_MS_2016-015_R1023_D001_S030.txt
- INMS_MS_2016-015_R1023_D001_S031.txt
- INMS_MS_2016-015_R1023_D001_S032.txt
- INMS_MS_2016-015_R1023_D001_S033.txt
- INMS_MS_2016-015_R1023_D001_S034.txt
- INMS_MS_2016-015_R1023_D001_S035.txt
- INMS_MS_2016-015_R1023_D001_S036.txt
- INMS_MS_2016-015_R1023_D001_S037.txt
- INMS_MS_2016-015_R1023_D001_S038.txt
- INMS_MS_2016-015_R1023_D001_S039.txt
- INMS_MS_2016-015_R1023_D001_S040.txt
- INMS_MS_2016-015_R1023_D001_S041.txt
- INMS_MS_2016-015_R1023_D001_S042.txt
- INMS_MS_2016-015_R1023_D001_S043.txt
- INMS_MS_2016-015_R1023_D001_S044.txt
- INMS_MS_2016-015_R1023_D001_S045.txt
- INMS_MS_2016-015_R1023_D001_S046.txt
- INMS_MS_2016-015_R1023_D001_S047.txt
- INMS_MS_2016-015_R1023_D001_S048.txt
- INMS_MS_2016-015_R1023_D001_S049.txt
- INMS_MS_2016-015_R1023_D001_S050.txt
- INMS_MS_2016-015_R1023_D001_S051.txt
- INMS_MS_2016-015_R1023_D001_S052.txt
- INMS_MS_2016-015_R1023_D001_S053.txt
- INMS_MS_2016-015_R1023_D001_S054.txt
- INMS_MS_2016-015_R1023_D001_S055.txt
- INMS_MS_2016-015_R1023_D001_S056.txt
- INMS_MS_2016-015_R1023_D001_S057.txt
- INMS_MS_2016-015_R1023_D001_S058.txt
- INMS_MS_2016-015_R1023_D001_S059.txt
- INMS_MS_2016-015_R1023_D001_S060.txt
- INMS_MS_2016-015_R1023_D001_S061.txt
- INMS_MS_2016-015_R1023_D001_S062.txt
- INMS_MS_2016-015_R1023_D001_S063.txt
- INMS_MS_2016-015_R1023_D001_S064.txt
- INMS_MS_2016-015_R1023_D001_S065.txt
- INMS_MS_2016-015_R1023_D001_S066.txt
- INMS_MS_2016-015_R1023_D001_S067.txt
- INMS_MS_2016-015_R1023_D001_S068.txt
- INMS_MS_2016-015_R1023_D001_S069.txt
- INMS_MS_2016-015_R1023_D001_S070.txt
- INMS_MS_2016-015_R1023_D001_S071.txt
- INMS_MS_2016-015_R1023_D001_S072.txt
- INMS_MS_2016-015_R1023_D001_S073.txt
- INMS_MS_2016-015_R1023_D001_S074.txt
- INMS_MS_2016-015_R1023_D001_S075.txt
- INMS_MS_2016-015_R1023_D001_S076.txt
- INMS_MS_2016-015_R1023_D001_S077.txt
- INMS_MS_2016-015_R1023_D001_S078.txt
- INMS_MS_2016-015_R1023_D001_S079.txt
- INMS_MS_2016-015_R1023_D001_S080.txt
- INMS_MS_2016-015_R1023_D001_S081.txt
- INMS_MS_2016-015_R1023_D002_S082.txt
- INMS_MS_2016-015_R1023_D002_S083.txt
- INMS_MS_2016-015_R1023_D002_S084.txt
- INMS_MS_2016-015_R1023_D002_S085.txt
- INMS_MS_2016-015_R1023_D002_S086.txt
- INMS_MS_2016-015_R1023_D002_S087.txt
- INMS_MS_2016-015_R1023_D002_S088.txt
- INMS_MS_2016-015_R1023_D002_S089.txt
- INMS_MS_2016-015_R1023_D002_S090.txt
- INMS_MS_2016-015_R1023_D002_S091.txt
- INMS_MS_2016-015_R1023_D002_S092.txt
- INMS_MS_2016-015_R1023_D002_S093.txt
- INMS_MS_2016-015_R1023_D002_S094.txt
- INMS_MS_2016-015_R1023_D002_S095.txt
- INMS_MS_2016-015_R1023_D002_S096.txt
- INMS_MS_2016-015_R1023_D002_S097.txt
- INMS_MS_2016-015_R1023_D002_S098.txt
- INMS_MS_2016-015_R1023_D002_S099.txt
- INMS_MS_2016-015_R1023_D002_S100.txt
- INMS_MS_2016-015_R1023_D002_S101.txt
- INMS_MS_2016-015_R1023_D002_S102.txt
- INMS_MS_2016-015_R1023_D002_S103.txt
- INMS_MS_2016-015_R1023_D002_S104.txt
- INMS_MS_2016-015_R1023_D002_S105.txt
- INMS_MS_2016-015_R1023_D002_S106.txt
- INMS_MS_2016-015_R1023_D002_S107.txt
- INMS_MS_2016-015_R1023_D002_S108.txt
- INMS_MS_2016-015_R1023_D002_S109.txt
- INMS_MS_2016-015_R1023_D002_S110.txt
- INMS_MS_2016-015_R1023_D002_S111.txt
- INMS_MS_2016-015_R1023_D002_S112.txt
- INMS_MS_2016-015_R1023_D002_S113.txt
- INMS_MS_2016-015_R1023_D002_S114.txt
- INMS_MS_2016-015_R1023_D002_S115.txt
- INMS_MS_2016-015_R1023_D002_S116.txt
- INMS_MS_2016-015_R1023_D002_S117.txt
- INMS_MS_2016-015_R1023_D002_S118.txt
- INMS_MS_2016-015_R1023_D002_S119.txt
- INMS_MS_2016-015_R1023_D002_S120.txt
- INMS_MS_2016-015_R1023_D002_S121.txt
- INMS_MS_2016-015_R1023_D002_S122.txt
- INMS_MS_2016-015_R1023_D002_S123.txt
- INMS_MS_2016-015_R1023_D002_S124.txt
- INMS_MS_2016-015_R1023_D002_S125.txt
- INMS_MS_2016-015_R1023_D002_S126.txt
- INMS_MS_2016-015_R1023_D002_S127.txt
- INMS_MS_2016-015_R1023_D002_S128.txt
- INMS_MS_2016-015_R1023_D002_S129.txt
- INMS_MS_2016-015_R1023_D002_S130.txt
- INMS_MS_2016-015_R1023_D002_S131.txt
- INMS_MS_2016-015_R1023_D002_S132.txt
- INMS_MS_2016-015_R1023_D002_S133.txt
- INMS_MS_2016-015_R1023_D002_S134.txt
- INMS_MS_2016-015_R1023_D002_S135.txt
- INMS_MS_2016-015_R1023_D002_S136.txt
- INMS_MS_2016-015_R1023_D002_S137.txt
- INMS_MS_2016-015_R1023_D002_S138.txt
- INMS_MS_2016-015_R1023_D002_S139.txt
- INMS_MS_2016-015_R1023_D002_S140.txt
- INMS_MS_2016-015_R1023_D002_S141.txt
- INMS_MS_2016-015_R1023_D002_S142.txt
- INMS_MS_2016-015_R1023_D002_S143.txt
- INMS_MS_2016-015_R1023_D002_S144.txt
- INMS_MS_2016-015_R1023_D002_S145.txt
- INMS_MS_2016-015_R1023_D002_S146.txt
- INMS_MS_2016-015_R1023_D002_S147.txt
- INMS_MS_2016-015_R1023_D002_S148.txt
- INMS_MS_2016-015_R1023_D002_S149.txt
- INMS_MS_2016-015_R1023_D002_S150.txt
- INMS_MS_2016-015_R1023_D002_S151.txt
- INMS_MS_2016-015_R1023_D002_S152.txt
- INMS_MS_2016-015_R1023_D002_S153.txt
- INMS_MS_2016-015_R1023_D002_S154.txt
- INMS_MS_2016-015_R1023_D002_S155.txt
- INMS_MS_2016-015_R1023_D002_S156.txt
- INMS_MS_2016-015_R1023_D002_S157.txt
- INMS_MS_2016-015_R1023_D002_S158.txt
- INMS_MS_2016-015_R1023_D002_S159.txt
- INMS_MS_2016-015_R1023_D002_S160.txt
- INMS_MS_2016-015_R1023_D002_S161.txt
- INMS_MS_2016-015_R1023_D003_S162.txt
- INMS_MS_2016-015_R1023_D003_S163.txt
- INMS_MS_2016-015_R1023_D003_S164.txt
- INMS_MS_2016-015_R1023_D003_S165.txt
- INMS_MS_2016-015_R1023_D003_S166.txt
- INMS_MS_2016-015_R1023_D003_S167.txt
- INMS_MS_2016-015_R1023_D003_S168.txt
- INMS_MS_2016-015_R1023_D003_S169.txt
- INMS_MS_2016-015_R1023_D003_S170.txt
- INMS_MS_2016-015_R1023_D003_S171.txt
- INMS_MS_2016-015_R1023_D003_S172.txt
- INMS_MS_2016-015_R1023_D003_S173.txt
- INMS_MS_2016-015_R1023_D003_S174.txt
- INMS_MS_2016-015_R1023_D003_S175.txt
- INMS_MS_2016-015_R1023_D003_S176.txt
- INMS_MS_2016-015_R1023_D003_S177.txt
- INMS_MS_2016-015_R1023_D003_S178.txt
- INMS_MS_2016-015_R1023_D003_S179.txt
- INMS_MS_2016-015_R1023_D003_S180.txt
- INMS_MS_2016-015_R1023_D003_S181.txt
- INMS_MS_2016-015_R1023_D003_S182.txt
- INMS_MS_2016-015_R1023_D003_S183.txt
- INMS_MS_2016-015_R1023_D003_S184.txt
- INMS_MS_2016-015_R1023_D003_S185.txt
- INMS_MS_2016-015_R1023_D003_S186.txt
- INMS_MS_2016-015_R1023_D003_S187.txt
- INMS_MS_2016-015_R1023_D003_S188.txt
- INMS_MS_2016-015_R1023_D003_S189.txt
- INMS_MS_2016-015_R1023_D003_S190.txt
- INMS_MS_2016-015_R1023_D003_S191.txt
- INMS_MS_2016-015_R1023_D003_S192.txt
- INMS_MS_2016-015_R1023_D003_S193.txt
- INMS_MS_2016-015_R1023_D003_S194.txt
- INMS_MS_2016-015_R1023_D003_S195.txt
- INMS_MS_2016-015_R1023_D003_S196.txt
- INMS_MS_2016-015_R1023_D003_S197.txt
- INMS_MS_2016-015_R1023_D003_S198.txt
- INMS_MS_2016-015_R1023_D003_S199.txt
- INMS_MS_2016-015_R1023_D003_S200.txt
- INMS_MS_2016-015_R1023_D003_S201.txt
- INMS_MS_2016-015_R1023_D003_S202.txt
- INMS_MS_2016-015_R1023_D003_S203.txt
- INMS_MS_2016-015_R1023_D003_S204.txt
- INMS_MS_2016-015_R1023_D003_S205.txt
- INMS_MS_2016-015_R1023_D003_S206.txt
- INMS_MS_2016-015_R1023_D003_S207.txt
- INMS_MS_2016-015_R1023_D003_S208.txt
- INMS_MS_2016-015_R1023_D003_S209.txt
- INMS_MS_2016-015_R1023_D003_S210.txt
- INMS_MS_2016-015_R1023_D003_S211.txt
- INMS_MS_2016-015_R1023_D003_S212.txt
- INMS_MS_2016-015_R1023_D003_S213.txt
- INMS_MS_2016-015_R1023_D003_S214.txt
- INMS_MS_2016-015_R1023_D003_S215.txt
- INMS_MS_2016-015_R1023_D003_S216.txt
- INMS_MS_2016-015_R1023_D003_S217.txt
- INMS_MS_2016-015_R1023_D003_S218.txt
- INMS_MS_2016-015_R1023_D003_S219.txt
- INMS_MS_2016-015_R1023_D003_S220.txt
- INMS_MS_2016-015_R1023_D003_S221.txt
- INMS_MS_2016-015_R1023_D003_S222.txt
- INMS_MS_2016-015_R1023_D003_S223.txt
- INMS_MS_2016-015_R1023_D003_S224.txt
- INMS_MS_2016-015_R1023_D003_S225.txt
- INMS_MS_2016-015_R1023_D003_S226.txt
- INMS_MS_2016-015_R1023_D003_S227.txt
- INMS_MS_2016-015_R1023_D003_S228.txt
- INMS_MS_2016-015_R1023_D003_S229.txt
- INMS_MS_2016-015_R1023_D003_S230.txt
- INMS_MS_2016-015_R1023_D003_S231.txt
- INMS_MS_2016-015_R1023_D003_S232.txt
- INMS_MS_2016-015_R1023_D003_S233.txt
- INMS_MS_2016-015_R1023_D003_S234.txt
- INMS_MS_2016-015_R1023_D003_S235.txt
- INMS_MS_2016-015_R1023_D003_S236.txt
- INMS_MS_2016-015_R1023_D003_S237.txt
- INMS_MS_2016-015_R1023_D003_S238.txt
- INMS_MS_2016-015_R1023_D003_S239.txt
- INMS_MS_2016-015_R1023_D003_S240.txt
- INMS_MS_2016-015_R1023_D003_S241.txt
- INMS_JN_2016-018_R1024.txt
- INMS_LG_2016-018.txt
- INMS_MN_2016-018_R1024.txt
- INMS_MS_2016-018_R1024_D001_S001.txt
- INMS_MS_2016-018_R1024_D001_S002.txt
- INMS_MS_2016-018_R1024_D001_S003.txt
- INMS_MS_2016-018_R1024_D001_S004.txt
- INMS_MS_2016-018_R1024_D001_S005.txt
- INMS_MS_2016-018_R1024_D001_S006.txt
- INMS_MS_2016-018_R1024_D001_S007.txt
- INMS_MS_2016-018_R1024_D001_S008.txt
- INMS_MS_2016-018_R1024_D001_S009.txt
- INMS_MS_2016-018_R1024_D001_S010.txt
- INMS_MS_2016-018_R1024_D001_S011.txt
- INMS_MS_2016-018_R1024_D001_S012.txt
- INMS_MS_2016-018_R1024_D001_S013.txt
- INMS_MS_2016-018_R1024_D001_S014.txt
- INMS_MS_2016-018_R1024_D001_S015.txt
- INMS_MS_2016-018_R1024_D001_S016.txt
- INMS_MS_2016-018_R1024_D001_S017.txt
- INMS_MS_2016-018_R1024_D001_S018.txt
- INMS_MS_2016-018_R1024_D001_S019.txt
- INMS_MS_2016-018_R1024_D001_S020.txt
- INMS_MS_2016-018_R1024_D001_S021.txt
- INMS_MS_2016-018_R1024_D001_S022.txt
- INMS_MS_2016-018_R1024_D001_S023.txt
- INMS_MS_2016-018_R1024_D001_S024.txt
- INMS_MS_2016-018_R1024_D001_S025.txt
- INMS_MS_2016-018_R1024_D001_S026.txt
- INMS_MS_2016-018_R1024_D001_S027.txt
- INMS_MS_2016-018_R1024_D001_S028.txt
- INMS_MS_2016-018_R1024_D001_S029.txt
- INMS_MS_2016-018_R1024_D001_S030.txt
- INMS_MS_2016-018_R1024_D001_S031.txt
- INMS_MS_2016-018_R1024_D001_S032.txt
- INMS_MS_2016-018_R1024_D001_S033.txt
- INMS_MS_2016-018_R1024_D001_S034.txt
- INMS_MS_2016-018_R1024_D001_S035.txt
- INMS_MS_2016-018_R1024_D001_S036.txt
- INMS_MS_2016-018_R1024_D001_S037.txt
- INMS_MS_2016-018_R1024_D001_S038.txt
- INMS_MS_2016-018_R1024_D001_S039.txt
- INMS_MS_2016-018_R1024_D001_S040.txt
- INMS_MS_2016-018_R1024_D001_S041.txt
- INMS_MS_2016-018_R1024_D001_S042.txt
- INMS_MS_2016-018_R1024_D001_S043.txt
- INMS_MS_2016-018_R1024_D001_S044.txt
- INMS_MS_2016-018_R1024_D001_S045.txt
- INMS_MS_2016-018_R1024_D001_S046.txt
- INMS_MS_2016-018_R1024_D001_S047.txt
- INMS_MS_2016-018_R1024_D001_S048.txt
- INMS_MS_2016-018_R1024_D001_S049.txt
- INMS_MS_2016-018_R1024_D001_S050.txt
- INMS_MS_2016-018_R1024_D001_S051.txt
- INMS_MS_2016-018_R1024_D001_S052.txt
- INMS_MS_2016-018_R1024_D001_S053.txt
- INMS_MS_2016-018_R1024_D001_S054.txt
- INMS_MS_2016-018_R1024_D001_S055.txt
- INMS_MS_2016-018_R1024_D001_S056.txt
- INMS_MS_2016-018_R1024_D001_S057.txt
- INMS_MS_2016-018_R1024_D001_S058.txt
- INMS_MS_2016-018_R1024_D001_S059.txt
- INMS_MS_2016-018_R1024_D001_S060.txt
- INMS_MS_2016-018_R1024_D001_S061.txt
- INMS_MS_2016-018_R1024_D001_S062.txt
- INMS_MS_2016-018_R1024_D001_S063.txt
- INMS_MS_2016-018_R1024_D001_S064.txt
- INMS_MS_2016-018_R1024_D001_S065.txt
- INMS_MS_2016-018_R1024_D001_S066.txt
- INMS_MS_2016-018_R1024_D001_S067.txt
- INMS_MS_2016-018_R1024_D001_S068.txt
- INMS_MS_2016-018_R1024_D001_S069.txt
- INMS_MS_2016-018_R1024_D001_S070.txt
- INMS_MS_2016-018_R1024_D001_S071.txt
- INMS_MS_2016-018_R1024_D001_S072.txt
- INMS_MS_2016-018_R1024_D001_S073.txt
- INMS_MS_2016-018_R1024_D001_S074.txt
- INMS_MS_2016-018_R1024_D001_S075.txt
- INMS_MS_2016-018_R1024_D001_S076.txt
- INMS_MS_2016-018_R1024_D001_S077.txt
- INMS_MS_2016-018_R1024_D001_S078.txt
- INMS_MS_2016-018_R1024_D001_S079.txt
- INMS_MS_2016-018_R1024_D001_S080.txt
- INMS_MS_2016-018_R1024_D002_S081.txt
- INMS_MS_2016-018_R1024_D002_S082.txt
- INMS_MS_2016-018_R1024_D002_S083.txt
- INMS_MS_2016-018_R1024_D002_S084.txt
- INMS_MS_2016-018_R1024_D002_S085.txt
- INMS_MS_2016-018_R1024_D002_S086.txt
- INMS_MS_2016-018_R1024_D002_S087.txt
- INMS_MS_2016-018_R1024_D002_S088.txt
- INMS_MS_2016-018_R1024_D002_S089.txt
- INMS_MS_2016-018_R1024_D002_S090.txt
- INMS_MS_2016-018_R1024_D002_S091.txt
- INMS_MS_2016-018_R1024_D002_S092.txt
- INMS_MS_2016-018_R1024_D002_S093.txt
- INMS_MS_2016-018_R1024_D002_S094.txt
- INMS_MS_2016-018_R1024_D002_S095.txt
- INMS_MS_2016-018_R1024_D002_S096.txt
- INMS_MS_2016-018_R1024_D002_S097.txt
- INMS_MS_2016-018_R1024_D002_S098.txt
- INMS_MS_2016-018_R1024_D002_S099.txt
- INMS_MS_2016-018_R1024_D002_S100.txt
- INMS_MS_2016-018_R1024_D002_S101.txt
- INMS_MS_2016-018_R1024_D002_S102.txt
- INMS_MS_2016-018_R1024_D002_S103.txt
- INMS_MS_2016-018_R1024_D002_S104.txt
- INMS_MS_2016-018_R1024_D002_S105.txt
- INMS_MS_2016-018_R1024_D002_S106.txt
- INMS_MS_2016-018_R1024_D002_S107.txt
- INMS_MS_2016-018_R1024_D002_S108.txt
- INMS_MS_2016-018_R1024_D002_S109.txt
- INMS_MS_2016-018_R1024_D002_S110.txt
- INMS_MS_2016-018_R1024_D002_S111.txt
- INMS_MS_2016-018_R1024_D002_S112.txt
- INMS_MS_2016-018_R1024_D002_S113.txt
- INMS_MS_2016-018_R1024_D002_S114.txt
- INMS_MS_2016-018_R1024_D002_S115.txt
- INMS_MS_2016-018_R1024_D002_S116.txt
- INMS_MS_2016-018_R1024_D002_S117.txt
- INMS_MS_2016-018_R1024_D002_S118.txt
- INMS_MS_2016-018_R1024_D002_S119.txt
- INMS_MS_2016-018_R1024_D002_S120.txt
- INMS_MS_2016-018_R1024_D002_S121.txt
- INMS_MS_2016-018_R1024_D002_S122.txt
- INMS_MS_2016-018_R1024_D002_S123.txt
- INMS_MS_2016-018_R1024_D002_S124.txt
- INMS_MS_2016-018_R1024_D002_S125.txt
- INMS_MS_2016-018_R1024_D002_S126.txt
- INMS_MS_2016-018_R1024_D002_S127.txt
- INMS_MS_2016-018_R1024_D002_S128.txt
- INMS_MS_2016-018_R1024_D002_S129.txt
- INMS_MS_2016-018_R1024_D002_S130.txt
- INMS_MS_2016-018_R1024_D002_S131.txt
- INMS_MS_2016-018_R1024_D002_S132.txt
- INMS_MS_2016-018_R1024_D002_S133.txt
- INMS_MS_2016-018_R1024_D002_S134.txt
- INMS_MS_2016-018_R1024_D002_S135.txt
- INMS_MS_2016-018_R1024_D002_S136.txt
- INMS_MS_2016-018_R1024_D002_S137.txt
- INMS_MS_2016-018_R1024_D002_S138.txt
- INMS_MS_2016-018_R1024_D002_S139.txt
- INMS_MS_2016-018_R1024_D002_S140.txt
- INMS_MS_2016-018_R1024_D002_S141.txt
- INMS_MS_2016-018_R1024_D002_S142.txt
- INMS_MS_2016-018_R1024_D002_S143.txt
- INMS_MS_2016-018_R1024_D002_S144.txt
- INMS_MS_2016-018_R1024_D002_S145.txt
- INMS_MS_2016-018_R1024_D002_S146.txt
- INMS_MS_2016-018_R1024_D002_S147.txt
- INMS_MS_2016-018_R1024_D002_S148.txt
- INMS_MS_2016-018_R1024_D002_S149.txt
- INMS_MS_2016-018_R1024_D002_S150.txt
- INMS_MS_2016-018_R1024_D002_S151.txt
- INMS_MS_2016-018_R1024_D002_S152.txt
- INMS_MS_2016-018_R1024_D002_S153.txt
- INMS_MS_2016-018_R1024_D002_S154.txt
- INMS_MS_2016-018_R1024_D002_S155.txt
- INMS_MS_2016-018_R1024_D002_S156.txt
- INMS_MS_2016-018_R1024_D002_S157.txt
- INMS_MS_2016-018_R1024_D002_S158.txt
- INMS_MS_2016-018_R1024_D002_S159.txt
- INMS_MS_2016-018_R1024_D002_S160.txt
- INMS_MS_2016-018_R1024_D003_S161.txt
- INMS_MS_2016-018_R1024_D003_S162.txt
- INMS_MS_2016-018_R1024_D003_S163.txt
- INMS_MS_2016-018_R1024_D003_S164.txt
- INMS_MS_2016-018_R1024_D003_S165.txt
- INMS_MS_2016-018_R1024_D003_S166.txt
- INMS_MS_2016-018_R1024_D003_S167.txt
- INMS_MS_2016-018_R1024_D003_S168.txt
- INMS_MS_2016-018_R1024_D003_S169.txt
- INMS_MS_2016-018_R1024_D003_S170.txt
- INMS_MS_2016-018_R1024_D003_S171.txt
- INMS_MS_2016-018_R1024_D003_S172.txt
- INMS_MS_2016-018_R1024_D003_S173.txt
- INMS_MS_2016-018_R1024_D003_S174.txt
- INMS_MS_2016-018_R1024_D003_S175.txt
- INMS_MS_2016-018_R1024_D003_S176.txt
- INMS_MS_2016-018_R1024_D003_S177.txt
- INMS_MS_2016-018_R1024_D003_S178.txt
- INMS_MS_2016-018_R1024_D003_S179.txt
- INMS_MS_2016-018_R1024_D003_S180.txt
- INMS_MS_2016-018_R1024_D003_S181.txt
- INMS_MS_2016-018_R1024_D003_S182.txt
- INMS_MS_2016-018_R1024_D003_S183.txt
- INMS_MS_2016-018_R1024_D003_S184.txt
- INMS_MS_2016-018_R1024_D003_S185.txt
- INMS_MS_2016-018_R1024_D003_S186.txt
- INMS_MS_2016-018_R1024_D003_S187.txt
- INMS_MS_2016-018_R1024_D003_S188.txt
- INMS_MS_2016-018_R1024_D003_S189.txt
- INMS_MS_2016-018_R1024_D003_S190.txt
- INMS_MS_2016-018_R1024_D003_S191.txt
- INMS_MS_2016-018_R1024_D003_S192.txt
- INMS_MS_2016-018_R1024_D003_S193.txt
- INMS_MS_2016-018_R1024_D003_S194.txt
- INMS_MS_2016-018_R1024_D003_S195.txt
- INMS_MS_2016-018_R1024_D003_S196.txt
- INMS_MS_2016-018_R1024_D003_S197.txt
- INMS_MS_2016-018_R1024_D003_S198.txt
- INMS_MS_2016-018_R1024_D003_S199.txt
- INMS_MS_2016-018_R1024_D003_S200.txt
- INMS_MS_2016-018_R1024_D003_S201.txt
- INMS_MS_2016-018_R1024_D003_S202.txt
- INMS_MS_2016-018_R1024_D003_S203.txt
- INMS_MS_2016-018_R1024_D003_S204.txt
- INMS_MS_2016-018_R1024_D003_S205.txt
- INMS_MS_2016-018_R1024_D003_S206.txt
- INMS_MS_2016-018_R1024_D003_S207.txt
- INMS_MS_2016-018_R1024_D003_S208.txt
- INMS_MS_2016-018_R1024_D003_S209.txt
- INMS_MS_2016-018_R1024_D003_S210.txt
- INMS_MS_2016-018_R1024_D003_S211.txt
- INMS_MS_2016-018_R1024_D003_S212.txt
- INMS_MS_2016-018_R1024_D003_S213.txt
- INMS_MS_2016-018_R1024_D003_S214.txt
- INMS_MS_2016-018_R1024_D003_S215.txt
- INMS_MS_2016-018_R1024_D003_S216.txt
- INMS_MS_2016-018_R1024_D003_S217.txt
- INMS_MS_2016-018_R1024_D003_S218.txt
- INMS_MS_2016-018_R1024_D003_S219.txt
- INMS_MS_2016-018_R1024_D003_S220.txt
- INMS_MS_2016-018_R1024_D003_S221.txt
- INMS_MS_2016-018_R1024_D003_S222.txt
- INMS_MS_2016-018_R1024_D003_S223.txt
- INMS_MS_2016-018_R1024_D003_S224.txt
- INMS_MS_2016-018_R1024_D003_S225.txt
- INMS_MS_2016-018_R1024_D003_S226.txt
- INMS_MS_2016-018_R1024_D003_S227.txt
- INMS_MS_2016-018_R1024_D003_S228.txt
- INMS_MS_2016-018_R1024_D003_S229.txt
- INMS_MS_2016-018_R1024_D003_S230.txt
- INMS_MS_2016-018_R1024_D003_S231.txt
- INMS_MS_2016-018_R1024_D003_S232.txt
- INMS_MS_2016-018_R1024_D003_S233.txt
- INMS_MS_2016-018_R1024_D003_S234.txt
- INMS_MS_2016-018_R1024_D003_S235.txt
- INMS_MS_2016-018_R1024_D003_S236.txt
- INMS_MS_2016-018_R1024_D003_S237.txt
- INMS_MS_2016-018_R1024_D003_S238.txt
- INMS_MS_2016-018_R1024_D003_S239.txt
- INMS_MS_2016-018_R1024_D003_S240.txt
- INMS_MS_2016-018_R1024_D004_S241.txt
- INMS_MS_2016-018_R1024_D004_S242.txt
- INMS_MS_2016-018_R1024_D004_S243.txt
- INMS_MS_2016-018_R1024_D004_S244.txt
- INMS_MS_2016-018_R1024_D004_S245.txt
- INMS_MS_2016-018_R1024_D004_S246.txt
- INMS_MS_2016-018_R1024_D004_S247.txt
- INMS_MS_2016-018_R1024_D004_S248.txt
- INMS_MS_2016-018_R1024_D004_S249.txt
- INMS_MS_2016-018_R1024_D004_S250.txt
- INMS_MS_2016-018_R1024_D004_S251.txt
- INMS_MS_2016-018_R1024_D004_S252.txt
- INMS_MS_2016-018_R1024_D004_S253.txt
- INMS_MS_2016-018_R1024_D004_S254.txt
- INMS_MS_2016-018_R1024_D004_S255.txt
- INMS_MS_2016-018_R1024_D004_S256.txt
- INMS_MS_2016-018_R1024_D004_S257.txt
- INMS_MS_2016-018_R1024_D004_S258.txt
- INMS_MS_2016-018_R1024_D004_S259.txt
- INMS_MS_2016-018_R1024_D004_S260.txt
- INMS_MS_2016-018_R1024_D004_S261.txt
- INMS_MS_2016-018_R1024_D004_S262.txt
- INMS_MS_2016-018_R1024_D004_S263.txt
- INMS_MS_2016-018_R1024_D004_S264.txt
- INMS_MS_2016-018_R1024_D004_S265.txt
- INMS_MS_2016-018_R1024_D004_S266.txt
- INMS_MS_2016-018_R1024_D004_S267.txt
- INMS_MS_2016-018_R1024_D004_S268.txt
- INMS_MS_2016-018_R1024_D004_S269.txt
- INMS_MS_2016-018_R1024_D004_S270.txt
- INMS_MS_2016-018_R1024_D004_S271.txt
- INMS_MS_2016-018_R1024_D004_S272.txt
- INMS_MS_2016-018_R1024_D004_S273.txt
- INMS_MS_2016-018_R1024_D004_S274.txt
- INMS_MS_2016-018_R1024_D004_S275.txt
- INMS_MS_2016-018_R1024_D004_S276.txt
- INMS_MS_2016-018_R1024_D004_S277.txt
- INMS_MS_2016-018_R1024_D004_S278.txt
- INMS_MS_2016-018_R1024_D004_S279.txt
- INMS_MS_2016-018_R1024_D004_S280.txt
- INMS_MS_2016-018_R1024_D004_S281.txt
- INMS_MS_2016-018_R1024_D004_S282.txt
- INMS_MS_2016-018_R1024_D004_S283.txt
- INMS_MS_2016-018_R1024_D004_S284.txt
- INMS_MS_2016-018_R1024_D004_S285.txt
- INMS_MS_2016-018_R1024_D004_S286.txt
- INMS_MS_2016-018_R1024_D004_S287.txt
- INMS_MS_2016-018_R1024_D004_S288.txt
- INMS_MS_2016-018_R1024_D004_S289.txt
- INMS_MS_2016-018_R1024_D004_S290.txt
- INMS_MS_2016-018_R1024_D004_S291.txt
- INMS_MS_2016-018_R1024_D004_S292.txt
- INMS_MS_2016-018_R1024_D004_S293.txt
- INMS_MS_2016-018_R1024_D004_S294.txt
- INMS_MS_2016-018_R1024_D004_S295.txt
- INMS_MS_2016-018_R1024_D004_S296.txt
- INMS_MS_2016-018_R1024_D004_S297.txt
- INMS_MS_2016-018_R1024_D004_S298.txt
- INMS_MS_2016-018_R1024_D004_S299.txt
- INMS_MS_2016-018_R1024_D004_S300.txt
- INMS_MS_2016-018_R1024_D004_S301.txt
- INMS_MS_2016-018_R1024_D004_S302.txt
- INMS_MS_2016-018_R1024_D004_S303.txt
- INMS_MS_2016-018_R1024_D004_S304.txt
- INMS_MS_2016-018_R1024_D004_S305.txt
- INMS_MS_2016-018_R1024_D004_S306.txt
- INMS_MS_2016-018_R1024_D004_S307.txt
- INMS_MS_2016-018_R1024_D004_S308.txt
- INMS_MS_2016-018_R1024_D004_S309.txt
- INMS_MS_2016-018_R1024_D004_S310.txt
- INMS_MS_2016-018_R1024_D004_S311.txt
- INMS_MS_2016-018_R1024_D004_S312.txt
- INMS_MS_2016-018_R1024_D004_S313.txt
- INMS_MS_2016-018_R1024_D004_S314.txt
- INMS_MS_2016-018_R1024_D004_S315.txt
- INMS_MS_2016-018_R1024_D004_S316.txt
- INMS_MS_2016-018_R1024_D004_S317.txt
- INMS_MS_2016-018_R1024_D004_S318.txt
- INMS_MS_2016-018_R1024_D004_S319.txt
- INMS_MS_2016-018_R1024_D004_S320.txt
- INMS_MS_2016-018_R1024_D005_S321.txt
- INMS_MS_2016-018_R1024_D005_S322.txt
- INMS_MS_2016-018_R1024_D005_S323.txt
- INMS_MS_2016-018_R1024_D005_S324.txt
- INMS_MS_2016-018_R1024_D005_S325.txt
- INMS_MS_2016-018_R1024_D005_S326.txt
- INMS_MS_2016-018_R1024_D005_S327.txt
- INMS_MS_2016-018_R1024_D005_S328.txt
- INMS_MS_2016-018_R1024_D005_S329.txt
- INMS_MS_2016-018_R1024_D005_S330.txt
- INMS_MS_2016-018_R1024_D005_S331.txt
- INMS_MS_2016-018_R1024_D005_S332.txt
- INMS_MS_2016-018_R1024_D005_S333.txt
- INMS_MS_2016-018_R1024_D005_S334.txt
- INMS_MS_2016-018_R1024_D005_S335.txt
- INMS_MS_2016-018_R1024_D005_S336.txt
- INMS_MS_2016-018_R1024_D005_S337.txt
- INMS_MS_2016-018_R1024_D005_S338.txt
- INMS_MS_2016-018_R1024_D005_S339.txt
- INMS_MS_2016-018_R1024_D005_S340.txt
- INMS_MS_2016-018_R1024_D005_S341.txt
- INMS_MS_2016-018_R1024_D005_S342.txt
- INMS_MS_2016-018_R1024_D005_S343.txt
- INMS_MS_2016-018_R1024_D005_S344.txt
- INMS_MS_2016-018_R1024_D005_S345.txt
- INMS_MS_2016-018_R1024_D005_S346.txt
- INMS_MS_2016-018_R1024_D005_S347.txt
- INMS_MS_2016-018_R1024_D005_S348.txt
- INMS_MS_2016-018_R1024_D005_S349.txt
- INMS_MS_2016-018_R1024_D005_S350.txt
- INMS_MS_2016-018_R1024_D005_S351.txt
- INMS_MS_2016-018_R1024_D005_S352.txt
- INMS_MS_2016-018_R1024_D005_S353.txt
- INMS_MS_2016-018_R1024_D005_S354.txt
- INMS_MS_2016-018_R1024_D005_S355.txt
- INMS_MS_2016-018_R1024_D005_S356.txt
- INMS_MS_2016-018_R1024_D005_S357.txt
- INMS_MS_2016-018_R1024_D005_S358.txt
- INMS_MS_2016-018_R1024_D005_S359.txt
- INMS_MS_2016-018_R1024_D005_S360.txt
- INMS_MS_2016-018_R1024_D005_S361.txt
- INMS_MS_2016-018_R1024_D005_S362.txt
- INMS_MS_2016-018_R1024_D005_S363.txt
- INMS_MS_2016-018_R1024_D005_S364.txt
- INMS_MS_2016-018_R1024_D005_S365.txt
- INMS_MS_2016-018_R1024_D005_S366.txt
- INMS_MS_2016-018_R1024_D005_S367.txt
- INMS_MS_2016-018_R1024_D005_S368.txt
- INMS_MS_2016-018_R1024_D005_S369.txt
- INMS_MS_2016-018_R1024_D005_S370.txt
- INMS_MS_2016-018_R1024_D005_S371.txt
- INMS_MS_2016-018_R1024_D005_S372.txt
- INMS_MS_2016-018_R1024_D005_S373.txt
- INMS_MS_2016-018_R1024_D005_S374.txt
- INMS_MS_2016-018_R1024_D005_S375.txt
- INMS_MS_2016-018_R1024_D005_S376.txt
- INMS_MS_2016-018_R1024_D005_S377.txt
- INMS_MS_2016-018_R1024_D005_S378.txt
- INMS_MS_2016-018_R1024_D005_S379.txt
- INMS_MS_2016-018_R1024_D005_S380.txt
- INMS_MS_2016-018_R1024_D005_S381.txt
- INMS_MS_2016-018_R1024_D005_S382.txt
- INMS_MS_2016-018_R1024_D005_S383.txt
- INMS_MS_2016-018_R1024_D005_S384.txt
- INMS_MS_2016-018_R1024_D005_S385.txt
- INMS_MS_2016-018_R1024_D005_S386.txt
- INMS_MS_2016-018_R1024_D005_S387.txt
- INMS_MS_2016-018_R1024_D005_S388.txt
- INMS_MS_2016-018_R1024_D005_S389.txt
- INMS_MS_2016-018_R1024_D005_S390.txt
- INMS_MS_2016-018_R1024_D005_S391.txt
- INMS_MS_2016-018_R1024_D005_S392.txt
- INMS_MS_2016-018_R1024_D005_S393.txt
- INMS_MS_2016-018_R1024_D005_S394.txt
- INMS_MS_2016-018_R1024_D005_S395.txt
- INMS_MS_2016-018_R1024_D005_S396.txt
- INMS_MS_2016-018_R1024_D005_S397.txt
- INMS_MS_2016-018_R1024_D005_S398.txt
- INMS_MS_2016-018_R1024_D005_S399.txt
- INMS_MS_2016-018_R1024_D005_S400.txt
- INMS_MS_2016-018_R1024_D006_S401.txt
- INMS_MS_2016-018_R1024_D006_S402.txt
- INMS_MS_2016-018_R1024_D006_S403.txt
- INMS_MS_2016-018_R1024_D006_S404.txt
- INMS_MS_2016-018_R1024_D006_S405.txt
- INMS_MS_2016-018_R1024_D006_S406.txt
- INMS_MS_2016-018_R1024_D006_S407.txt
- INMS_MS_2016-018_R1024_D006_S408.txt
- INMS_MS_2016-018_R1024_D006_S409.txt
- INMS_MS_2016-018_R1024_D006_S410.txt
- INMS_MS_2016-018_R1024_D006_S411.txt
- INMS_MS_2016-018_R1024_D006_S412.txt
- INMS_MS_2016-018_R1024_D006_S413.txt
- INMS_MS_2016-018_R1024_D006_S414.txt
- INMS_MS_2016-018_R1024_D006_S415.txt
- INMS_MS_2016-018_R1024_D006_S416.txt
- INMS_MS_2016-018_R1024_D006_S417.txt
- INMS_MS_2016-018_R1024_D006_S418.txt
- INMS_MS_2016-018_R1024_D006_S419.txt
- INMS_MS_2016-018_R1024_D006_S420.txt
- INMS_MS_2016-018_R1024_D006_S421.txt
- INMS_MS_2016-018_R1024_D006_S422.txt
- INMS_MS_2016-018_R1024_D006_S423.txt
- INMS_MS_2016-018_R1024_D006_S424.txt
- INMS_MS_2016-018_R1024_D006_S425.txt
- INMS_MS_2016-018_R1024_D006_S426.txt
- INMS_MS_2016-018_R1024_D006_S427.txt
- INMS_MS_2016-018_R1024_D006_S428.txt
- INMS_MS_2016-018_R1024_D006_S429.txt
- INMS_MS_2016-018_R1024_D006_S430.txt
- INMS_MS_2016-018_R1024_D006_S431.txt
- INMS_MS_2016-018_R1024_D006_S432.txt
- INMS_MS_2016-018_R1024_D006_S433.txt
- INMS_MS_2016-018_R1024_D006_S434.txt
- INMS_MS_2016-018_R1024_D006_S435.txt
- INMS_MS_2016-018_R1024_D006_S436.txt
- INMS_MS_2016-018_R1024_D006_S437.txt
- INMS_MS_2016-018_R1024_D006_S438.txt
- INMS_MS_2016-018_R1024_D006_S439.txt
- INMS_MS_2016-018_R1024_D006_S440.txt
- INMS_MS_2016-018_R1024_D006_S441.txt
- INMS_MS_2016-018_R1024_D006_S442.txt
- INMS_MS_2016-018_R1024_D006_S443.txt
- INMS_MS_2016-018_R1024_D006_S444.txt
- INMS_MS_2016-018_R1024_D006_S445.txt
- INMS_MS_2016-018_R1024_D006_S446.txt
- INMS_MS_2016-018_R1024_D006_S447.txt
- INMS_MS_2016-018_R1024_D006_S448.txt
- INMS_MS_2016-018_R1024_D006_S449.txt
- INMS_MS_2016-018_R1024_D006_S450.txt
- INMS_MS_2016-018_R1024_D006_S451.txt
- INMS_MS_2016-018_R1024_D006_S452.txt
- INMS_MS_2016-018_R1024_D006_S453.txt
- INMS_MS_2016-018_R1024_D006_S454.txt
- INMS_MS_2016-018_R1024_D006_S455.txt
- INMS_MS_2016-018_R1024_D006_S456.txt
- INMS_MS_2016-018_R1024_D006_S457.txt
- INMS_MS_2016-018_R1024_D006_S458.txt
- INMS_MS_2016-018_R1024_D006_S459.txt
- INMS_MS_2016-018_R1024_D006_S460.txt
- INMS_MS_2016-018_R1024_D006_S461.txt
- INMS_MS_2016-018_R1024_D006_S462.txt
- INMS_MS_2016-018_R1024_D006_S463.txt
- INMS_MS_2016-018_R1024_D006_S464.txt
- INMS_MS_2016-018_R1024_D006_S465.txt
- INMS_MS_2016-018_R1024_D006_S466.txt
- INMS_MS_2016-018_R1024_D006_S467.txt
- INMS_MS_2016-018_R1024_D006_S468.txt
- INMS_MS_2016-018_R1024_D006_S469.txt
- INMS_MS_2016-018_R1024_D006_S470.txt
- INMS_MS_2016-018_R1024_D006_S471.txt
- INMS_MS_2016-018_R1024_D006_S472.txt
- INMS_MS_2016-018_R1024_D006_S473.txt
- INMS_MS_2016-018_R1024_D006_S474.txt
- INMS_MS_2016-018_R1024_D006_S475.txt
- INMS_MS_2016-018_R1024_D006_S476.txt
- INMS_MS_2016-018_R1024_D006_S477.txt
- INMS_MS_2016-018_R1024_D006_S478.txt
- INMS_MS_2016-018_R1024_D006_S479.txt
- INMS_MS_2016-018_R1024_D006_S480.txt
- INMS_MS_2016-018_R1024_D007_S481.txt
- INMS_MS_2016-018_R1024_D007_S482.txt
- INMS_MS_2016-018_R1024_D007_S483.txt
- INMS_MS_2016-018_R1024_D007_S484.txt
- INMS_MS_2016-018_R1024_D007_S485.txt
- INMS_MS_2016-018_R1024_D007_S486.txt
- INMS_MS_2016-018_R1024_D007_S487.txt
- INMS_MS_2016-018_R1024_D007_S488.txt
- INMS_MS_2016-018_R1024_D007_S489.txt
- INMS_MS_2016-018_R1024_D007_S490.txt
- INMS_MS_2016-018_R1024_D007_S491.txt
- INMS_MS_2016-018_R1024_D007_S492.txt
- INMS_MS_2016-018_R1024_D007_S493.txt
- INMS_MS_2016-018_R1024_D007_S494.txt
- INMS_MS_2016-018_R1024_D007_S495.txt
- INMS_MS_2016-018_R1024_D007_S496.txt
- INMS_MS_2016-018_R1024_D007_S497.txt
- INMS_MS_2016-018_R1024_D007_S498.txt
- INMS_MS_2016-018_R1024_D007_S499.txt
- INMS_MS_2016-018_R1024_D007_S500.txt
- INMS_MS_2016-018_R1024_D007_S501.txt
- INMS_MS_2016-018_R1024_D007_S502.txt
- INMS_MS_2016-018_R1024_D007_S503.txt
- INMS_MS_2016-018_R1024_D007_S504.txt
- INMS_MS_2016-018_R1024_D007_S505.txt
- INMS_MS_2016-018_R1024_D007_S506.txt
- INMS_MS_2016-018_R1024_D007_S507.txt
- INMS_MS_2016-018_R1024_D007_S508.txt
- INMS_MS_2016-018_R1024_D007_S509.txt
- INMS_MS_2016-018_R1024_D007_S510.txt
- INMS_MS_2016-018_R1024_D007_S511.txt
- INMS_MS_2016-018_R1024_D007_S512.txt
- INMS_MS_2016-018_R1024_D007_S513.txt
- INMS_MS_2016-018_R1024_D007_S514.txt
- INMS_MS_2016-018_R1024_D007_S515.txt
- INMS_MS_2016-018_R1024_D007_S516.txt
- INMS_MS_2016-018_R1024_D007_S517.txt
- INMS_MS_2016-018_R1024_D007_S518.txt
- INMS_MS_2016-018_R1024_D007_S519.txt
- INMS_MS_2016-018_R1024_D007_S520.txt
- INMS_MS_2016-018_R1024_D007_S521.txt
- INMS_MS_2016-018_R1024_D007_S522.txt
- INMS_MS_2016-018_R1024_D007_S523.txt
- INMS_MS_2016-018_R1024_D007_S524.txt
- INMS_MS_2016-018_R1024_D007_S525.txt
- INMS_MS_2016-018_R1024_D007_S526.txt
- INMS_MS_2016-018_R1024_D007_S527.txt
- INMS_MS_2016-018_R1024_D007_S528.txt
- INMS_MS_2016-018_R1024_D007_S529.txt
- INMS_MS_2016-018_R1024_D007_S530.txt
- INMS_MS_2016-018_R1024_D007_S531.txt
- INMS_MS_2016-018_R1024_D007_S532.txt
- INMS_MS_2016-018_R1024_D007_S533.txt
- INMS_MS_2016-018_R1024_D007_S534.txt
- INMS_MS_2016-018_R1024_D007_S535.txt
- INMS_MS_2016-018_R1024_D007_S536.txt
- INMS_MS_2016-018_R1024_D007_S537.txt
- INMS_MS_2016-018_R1024_D007_S538.txt
- INMS_MS_2016-018_R1024_D007_S539.txt
- INMS_MS_2016-018_R1024_D007_S540.txt
- INMS_MS_2016-018_R1024_D007_S541.txt
- INMS_MS_2016-018_R1024_D007_S542.txt
- INMS_MS_2016-018_R1024_D007_S543.txt
- INMS_MS_2016-018_R1024_D007_S544.txt
- INMS_MS_2016-018_R1024_D007_S545.txt
- INMS_MS_2016-018_R1024_D007_S546.txt
- INMS_MS_2016-018_R1024_D007_S547.txt
- INMS_MS_2016-018_R1024_D007_S548.txt
- INMS_MS_2016-018_R1024_D007_S549.txt
- INMS_MS_2016-018_R1024_D007_S550.txt
- INMS_MS_2016-018_R1024_D007_S551.txt
- INMS_MS_2016-018_R1024_D007_S552.txt
- INMS_MS_2016-018_R1024_D007_S553.txt
- INMS_MS_2016-018_R1024_D007_S554.txt
- INMS_MS_2016-018_R1024_D007_S555.txt
- INMS_MS_2016-018_R1024_D007_S556.txt
- INMS_MS_2016-018_R1024_D007_S557.txt
- INMS_MS_2016-018_R1024_D007_S558.txt
- INMS_MS_2016-018_R1024_D007_S559.txt
- INMS_MS_2016-018_R1024_D007_S560.txt
- INMS_MS_2016-018_R1024_D008_S561.txt
- INMS_MS_2016-018_R1024_D008_S562.txt
- INMS_MS_2016-018_R1024_D008_S563.txt
- INMS_MS_2016-018_R1024_D008_S564.txt
- INMS_MS_2016-018_R1024_D008_S565.txt
- INMS_MS_2016-018_R1024_D008_S566.txt
- INMS_MS_2016-018_R1024_D008_S567.txt
- INMS_MS_2016-018_R1024_D008_S568.txt
- INMS_MS_2016-018_R1024_D008_S569.txt
- INMS_MS_2016-018_R1024_D008_S570.txt
- INMS_MS_2016-018_R1024_D008_S571.txt
- INMS_MS_2016-018_R1024_D008_S572.txt
- INMS_MS_2016-018_R1024_D008_S573.txt
- INMS_MS_2016-018_R1024_D008_S574.txt
- INMS_MS_2016-018_R1024_D008_S575.txt
- INMS_MS_2016-018_R1024_D008_S576.txt
- INMS_MS_2016-018_R1024_D008_S577.txt
- INMS_MS_2016-018_R1024_D008_S578.txt
- INMS_MS_2016-018_R1024_D008_S579.txt
- INMS_MS_2016-018_R1024_D008_S580.txt
- INMS_MS_2016-018_R1024_D008_S581.txt
- INMS_MS_2016-018_R1024_D008_S582.txt
- INMS_MS_2016-018_R1024_D008_S583.txt
- INMS_MS_2016-018_R1024_D008_S584.txt
- INMS_MS_2016-018_R1024_D008_S585.txt
- INMS_MS_2016-018_R1024_D008_S586.txt
- INMS_MS_2016-018_R1024_D008_S587.txt
- INMS_MS_2016-018_R1024_D008_S588.txt
- INMS_MS_2016-018_R1024_D008_S589.txt
- INMS_MS_2016-018_R1024_D008_S590.txt
- INMS_MS_2016-018_R1024_D008_S591.txt
- INMS_MS_2016-018_R1024_D008_S592.txt
- INMS_MS_2016-018_R1024_D008_S593.txt
- INMS_MS_2016-018_R1024_D008_S594.txt
- INMS_MS_2016-018_R1024_D008_S595.txt
- INMS_MS_2016-018_R1024_D008_S596.txt
- INMS_MS_2016-018_R1024_D008_S597.txt
- INMS_MS_2016-018_R1024_D008_S598.txt
- INMS_MS_2016-018_R1024_D008_S599.txt
- INMS_MS_2016-018_R1024_D008_S600.txt
- INMS_MS_2016-018_R1024_D008_S601.txt
- INMS_MS_2016-018_R1024_D008_S602.txt
- INMS_MS_2016-018_R1024_D008_S603.txt
- INMS_MS_2016-018_R1024_D008_S604.txt
- INMS_MS_2016-018_R1024_D008_S605.txt
- INMS_MS_2016-018_R1024_D008_S606.txt
- INMS_MS_2016-018_R1024_D008_S607.txt
- INMS_MS_2016-018_R1024_D008_S608.txt
- INMS_MS_2016-018_R1024_D008_S609.txt
- INMS_MS_2016-018_R1024_D008_S610.txt
- INMS_MS_2016-018_R1024_D008_S611.txt
- INMS_MS_2016-018_R1024_D008_S612.txt
- INMS_MS_2016-018_R1024_D008_S613.txt
- INMS_MS_2016-018_R1024_D008_S614.txt
- INMS_MS_2016-018_R1024_D008_S615.txt
- INMS_MS_2016-018_R1024_D008_S616.txt
- INMS_MS_2016-018_R1024_D008_S617.txt
- INMS_MS_2016-018_R1024_D008_S618.txt
- INMS_MS_2016-018_R1024_D008_S619.txt
- INMS_MS_2016-018_R1024_D008_S620.txt
- INMS_MS_2016-018_R1024_D008_S621.txt
- INMS_MS_2016-018_R1024_D008_S622.txt
- INMS_MS_2016-018_R1024_D008_S623.txt
- INMS_MS_2016-018_R1024_D008_S624.txt
- INMS_MS_2016-018_R1024_D008_S625.txt
- INMS_MS_2016-018_R1024_D008_S626.txt
- INMS_MS_2016-018_R1024_D008_S627.txt
- INMS_MS_2016-018_R1024_D008_S628.txt
- INMS_MS_2016-018_R1024_D008_S629.txt
- INMS_MS_2016-018_R1024_D008_S630.txt
- INMS_MS_2016-018_R1024_D008_S631.txt
- INMS_MS_2016-018_R1024_D008_S632.txt
- INMS_MS_2016-018_R1024_D008_S633.txt
- INMS_MS_2016-018_R1024_D008_S634.txt
- INMS_MS_2016-018_R1024_D008_S635.txt
- INMS_MS_2016-018_R1024_D008_S636.txt
- INMS_MS_2016-018_R1024_D008_S637.txt
- INMS_MS_2016-018_R1024_D008_S638.txt
- INMS_MS_2016-018_R1024_D008_S639.txt
- INMS_MS_2016-018_R1024_D008_S640.txt
- INMS_MS_2016-018_R1024_D009_S641.txt
- INMS_MS_2016-018_R1024_D009_S642.txt
- INMS_MS_2016-018_R1024_D009_S643.txt
- INMS_MS_2016-018_R1024_D009_S644.txt
- INMS_MS_2016-018_R1024_D009_S645.txt
- INMS_MS_2016-018_R1024_D009_S646.txt
- INMS_MS_2016-018_R1024_D009_S647.txt
- INMS_MS_2016-018_R1024_D009_S648.txt
- INMS_MS_2016-018_R1024_D009_S649.txt
- INMS_MS_2016-018_R1024_D009_S650.txt
- INMS_MS_2016-018_R1024_D009_S651.txt
- INMS_MS_2016-018_R1024_D009_S652.txt
- INMS_MS_2016-018_R1024_D009_S653.txt
- INMS_MS_2016-018_R1024_D009_S654.txt
- INMS_MS_2016-018_R1024_D009_S655.txt
- INMS_MS_2016-018_R1024_D009_S656.txt
- INMS_MS_2016-018_R1024_D009_S657.txt
- INMS_MS_2016-018_R1024_D009_S658.txt
- INMS_MS_2016-018_R1024_D009_S659.txt
- INMS_MS_2016-018_R1024_D009_S660.txt
- INMS_MS_2016-018_R1024_D009_S661.txt
- INMS_MS_2016-018_R1024_D009_S662.txt
- INMS_MS_2016-018_R1024_D009_S663.txt
- INMS_MS_2016-018_R1024_D009_S664.txt
- INMS_MS_2016-018_R1024_D009_S665.txt
- INMS_MS_2016-018_R1024_D009_S666.txt
- INMS_MS_2016-018_R1024_D009_S667.txt
- INMS_MS_2016-018_R1024_D009_S668.txt
- INMS_MS_2016-018_R1024_D009_S669.txt
- INMS_MS_2016-018_R1024_D009_S670.txt
- INMS_MS_2016-018_R1024_D009_S671.txt
- INMS_MS_2016-018_R1024_D009_S672.txt
- INMS_MS_2016-018_R1024_D009_S673.txt
- INMS_MS_2016-018_R1024_D009_S674.txt
- INMS_MS_2016-018_R1024_D009_S675.txt
- INMS_MS_2016-018_R1024_D009_S676.txt
- INMS_MS_2016-018_R1024_D009_S677.txt
- INMS_MS_2016-018_R1024_D009_S678.txt
- INMS_MS_2016-018_R1024_D009_S679.txt
- INMS_MS_2016-018_R1024_D009_S680.txt
- INMS_MS_2016-018_R1024_D009_S681.txt
- INMS_MS_2016-018_R1024_D009_S682.txt
- INMS_MS_2016-018_R1024_D009_S683.txt
- INMS_MS_2016-018_R1024_D009_S684.txt
- INMS_MS_2016-018_R1024_D009_S685.txt
- INMS_MS_2016-018_R1024_D009_S686.txt
- INMS_MS_2016-018_R1024_D009_S687.txt
- INMS_MS_2016-018_R1024_D009_S688.txt
- INMS_MS_2016-018_R1024_D009_S689.txt
- INMS_MS_2016-018_R1024_D009_S690.txt
- INMS_MS_2016-018_R1024_D009_S691.txt
- INMS_MS_2016-018_R1024_D009_S692.txt
- INMS_MS_2016-018_R1024_D009_S693.txt
- INMS_MS_2016-018_R1024_D009_S694.txt
- INMS_MS_2016-018_R1024_D009_S695.txt
- INMS_MS_2016-018_R1024_D009_S696.txt
- INMS_MS_2016-018_R1024_D009_S697.txt
- INMS_MS_2016-018_R1024_D009_S698.txt
- INMS_MS_2016-018_R1024_D009_S699.txt
- INMS_MS_2016-018_R1024_D009_S700.txt
- INMS_MS_2016-018_R1024_D009_S701.txt
- INMS_MS_2016-018_R1024_D009_S702.txt
- INMS_MS_2016-018_R1024_D009_S703.txt
- INMS_MS_2016-018_R1024_D009_S704.txt
- INMS_MS_2016-018_R1024_D009_S705.txt
- INMS_MS_2016-018_R1024_D009_S706.txt
- INMS_MS_2016-018_R1024_D009_S707.txt
- INMS_MS_2016-018_R1024_D009_S708.txt
- INMS_MS_2016-018_R1024_D009_S709.txt
- INMS_MS_2016-018_R1024_D009_S710.txt
- INMS_MS_2016-018_R1024_D009_S711.txt
- INMS_MS_2016-018_R1024_D009_S712.txt
- INMS_MS_2016-018_R1024_D009_S713.txt
- INMS_MS_2016-018_R1024_D009_S714.txt
- INMS_MS_2016-018_R1024_D009_S715.txt
- INMS_MS_2016-018_R1024_D009_S716.txt
- INMS_MS_2016-018_R1024_D009_S717.txt
- INMS_MS_2016-018_R1024_D009_S718.txt
- INMS_MS_2016-018_R1024_D009_S719.txt
- INMS_MS_2016-018_R1024_D009_S720.txt
- INMS_MS_2016-018_R1024_D010_S721.txt
- INMS_MS_2016-018_R1024_D010_S722.txt
- INMS_MS_2016-018_R1024_D010_S723.txt
- INMS_MS_2016-018_R1024_D010_S724.txt
- INMS_MS_2016-018_R1024_D010_S725.txt
- INMS_MS_2016-018_R1024_D010_S726.txt
- INMS_MS_2016-018_R1024_D010_S727.txt
- INMS_MS_2016-018_R1024_D010_S728.txt
- INMS_MS_2016-018_R1024_D010_S729.txt
- INMS_MS_2016-018_R1024_D010_S730.txt
- INMS_MS_2016-018_R1024_D010_S731.txt
- INMS_MS_2016-018_R1024_D010_S732.txt
- INMS_MS_2016-018_R1024_D010_S733.txt
- INMS_MS_2016-018_R1024_D010_S734.txt
- INMS_MS_2016-018_R1024_D010_S735.txt
- INMS_MS_2016-018_R1024_D010_S736.txt
- INMS_MS_2016-018_R1024_D010_S737.txt
- INMS_MS_2016-018_R1024_D010_S738.txt
- INMS_MS_2016-018_R1024_D010_S739.txt
- INMS_MS_2016-018_R1024_D010_S740.txt
- INMS_MS_2016-018_R1024_D010_S741.txt
- INMS_MS_2016-018_R1024_D010_S742.txt
- INMS_MS_2016-018_R1024_D010_S743.txt
- INMS_MS_2016-018_R1024_D010_S744.txt
- INMS_MS_2016-018_R1024_D010_S745.txt
- INMS_MS_2016-018_R1024_D010_S746.txt
- INMS_MS_2016-018_R1024_D010_S747.txt
- INMS_MS_2016-018_R1024_D010_S748.txt
- INMS_MS_2016-018_R1024_D010_S749.txt
- INMS_MS_2016-018_R1024_D010_S750.txt
- INMS_MS_2016-018_R1024_D010_S751.txt
- INMS_MS_2016-018_R1024_D010_S752.txt
- INMS_MS_2016-018_R1024_D010_S753.txt
- INMS_MS_2016-018_R1024_D010_S754.txt
- INMS_MS_2016-018_R1024_D010_S755.txt
- INMS_MS_2016-018_R1024_D010_S756.txt
- INMS_MS_2016-018_R1024_D010_S757.txt
- INMS_MS_2016-018_R1024_D010_S758.txt
- INMS_MS_2016-018_R1024_D010_S759.txt
- INMS_MS_2016-018_R1024_D010_S760.txt
- INMS_MS_2016-018_R1024_D010_S761.txt
- INMS_MS_2016-018_R1024_D010_S762.txt
- INMS_MS_2016-018_R1024_D010_S763.txt
- INMS_MS_2016-018_R1024_D010_S764.txt
- INMS_MS_2016-018_R1024_D010_S765.txt
- INMS_MS_2016-018_R1024_D010_S766.txt
- INMS_MS_2016-018_R1024_D010_S767.txt
- INMS_MS_2016-018_R1024_D010_S768.txt
- INMS_MS_2016-018_R1024_D010_S769.txt
- INMS_MS_2016-018_R1024_D010_S770.txt
- INMS_MS_2016-018_R1024_D010_S771.txt
- INMS_MS_2016-018_R1024_D010_S772.txt
- INMS_MS_2016-018_R1024_D010_S773.txt
- INMS_MS_2016-018_R1024_D010_S774.txt
- INMS_MS_2016-018_R1024_D010_S775.txt
- INMS_MS_2016-018_R1024_D010_S776.txt
- INMS_MS_2016-018_R1024_D010_S777.txt
- INMS_MS_2016-018_R1024_D010_S778.txt
- INMS_MS_2016-018_R1024_D010_S779.txt
- INMS_MS_2016-018_R1024_D010_S780.txt
- INMS_MS_2016-018_R1024_D010_S781.txt
- INMS_MS_2016-018_R1024_D010_S782.txt
- INMS_MS_2016-018_R1024_D010_S783.txt
- INMS_MS_2016-018_R1024_D010_S784.txt
- INMS_MS_2016-018_R1024_D010_S785.txt
- INMS_MS_2016-018_R1024_D010_S786.txt
- INMS_MS_2016-018_R1024_D010_S787.txt
- INMS_MS_2016-018_R1024_D010_S788.txt
- INMS_MS_2016-018_R1024_D010_S789.txt
- INMS_MS_2016-018_R1024_D010_S790.txt
- INMS_MS_2016-018_R1024_D010_S791.txt
- INMS_MS_2016-018_R1024_D010_S792.txt
- INMS_MS_2016-018_R1024_D010_S793.txt
- INMS_MS_2016-018_R1024_D010_S794.txt
- INMS_MS_2016-018_R1024_D010_S795.txt
- INMS_MS_2016-018_R1024_D010_S796.txt
- INMS_MS_2016-018_R1024_D010_S797.txt
- INMS_MS_2016-018_R1024_D010_S798.txt
- INMS_MS_2016-018_R1024_D010_S799.txt
- INMS_MS_2016-018_R1024_D010_S800.txt
- INMS_MS_2016-018_R1024_D011_S801.txt
- INMS_MS_2016-018_R1024_D011_S802.txt
- INMS_MS_2016-018_R1024_D011_S803.txt
- INMS_MS_2016-018_R1024_D011_S804.txt
- INMS_MS_2016-018_R1024_D011_S805.txt
- INMS_MS_2016-018_R1024_D011_S806.txt
- INMS_MS_2016-018_R1024_D011_S807.txt
- INMS_MS_2016-018_R1024_D011_S808.txt
- INMS_MS_2016-018_R1024_D011_S809.txt
- INMS_MS_2016-018_R1024_D011_S810.txt
- INMS_MS_2016-018_R1024_D011_S811.txt
- INMS_MS_2016-018_R1024_D011_S812.txt
- INMS_MS_2016-018_R1024_D011_S813.txt
- INMS_MS_2016-018_R1024_D011_S814.txt
- INMS_MS_2016-018_R1024_D011_S815.txt
- INMS_MS_2016-018_R1024_D011_S816.txt
- INMS_MS_2016-018_R1024_D011_S817.txt
- INMS_MS_2016-018_R1024_D011_S818.txt
- INMS_MS_2016-018_R1024_D011_S819.txt
- INMS_MS_2016-018_R1024_D011_S820.txt
- INMS_MS_2016-018_R1024_D011_S821.txt
- INMS_MS_2016-018_R1024_D011_S822.txt
- INMS_MS_2016-018_R1024_D011_S823.txt
- INMS_MS_2016-018_R1024_D011_S824.txt
- INMS_MS_2016-018_R1024_D011_S825.txt
- INMS_MS_2016-018_R1024_D011_S826.txt
- INMS_MS_2016-018_R1024_D011_S827.txt
- INMS_MS_2016-018_R1024_D011_S828.txt
- INMS_MS_2016-018_R1024_D011_S829.txt
- INMS_MS_2016-018_R1024_D011_S830.txt
- INMS_MS_2016-018_R1024_D011_S831.txt
- INMS_MS_2016-018_R1024_D011_S832.txt
- INMS_MS_2016-018_R1024_D011_S833.txt
- INMS_MS_2016-018_R1024_D011_S834.txt
- INMS_MS_2016-018_R1024_D011_S835.txt
- INMS_MS_2016-018_R1024_D011_S836.txt
- INMS_MS_2016-018_R1024_D011_S837.txt
- INMS_MS_2016-018_R1024_D011_S838.txt
- INMS_MS_2016-018_R1024_D011_S839.txt
- INMS_MS_2016-018_R1024_D011_S840.txt
- INMS_MS_2016-018_R1024_D011_S841.txt
- INMS_MS_2016-018_R1024_D011_S842.txt
- INMS_MS_2016-018_R1024_D011_S843.txt
- INMS_MS_2016-018_R1024_D011_S844.txt
- INMS_MS_2016-018_R1024_D011_S845.txt
- INMS_MS_2016-018_R1024_D011_S846.txt
- INMS_MS_2016-018_R1024_D011_S847.txt
- INMS_MS_2016-018_R1024_D011_S848.txt
- INMS_MS_2016-018_R1024_D011_S849.txt
- INMS_MS_2016-018_R1024_D011_S850.txt
- INMS_MS_2016-018_R1024_D011_S851.txt
- INMS_MS_2016-018_R1024_D011_S852.txt
- INMS_MS_2016-018_R1024_D011_S853.txt
- INMS_MS_2016-018_R1024_D011_S854.txt
- INMS_MS_2016-018_R1024_D011_S855.txt
- INMS_MS_2016-018_R1024_D011_S856.txt
- INMS_MS_2016-018_R1024_D011_S857.txt
- INMS_MS_2016-018_R1024_D011_S858.txt
- INMS_MS_2016-018_R1024_D011_S859.txt
- INMS_MS_2016-018_R1024_D011_S860.txt
- INMS_MS_2016-018_R1024_D011_S861.txt
- INMS_MS_2016-018_R1024_D011_S862.txt
- INMS_MS_2016-018_R1024_D011_S863.txt
- INMS_MS_2016-018_R1024_D011_S864.txt
- INMS_MS_2016-018_R1024_D011_S865.txt
- INMS_MS_2016-018_R1024_D011_S866.txt
- INMS_MS_2016-018_R1024_D011_S867.txt
- INMS_MS_2016-018_R1024_D011_S868.txt
- INMS_MS_2016-018_R1024_D011_S869.txt
- INMS_MS_2016-018_R1024_D011_S870.txt
- INMS_MS_2016-018_R1024_D011_S871.txt
- INMS_MS_2016-018_R1024_D011_S872.txt
- INMS_MS_2016-018_R1024_D011_S873.txt
- INMS_MS_2016-018_R1024_D011_S874.txt
- INMS_MS_2016-018_R1024_D011_S875.txt
- INMS_MS_2016-018_R1024_D011_S876.txt
- INMS_MS_2016-018_R1024_D011_S877.txt
- INMS_MS_2016-018_R1024_D011_S878.txt
- INMS_MS_2016-018_R1024_D011_S879.txt
- INMS_MS_2016-018_R1024_D011_S880.txt
- INMS_JN_2016-027_R1025.txt
- INMS_JN_2016-027_R1026.txt
- INMS_LG_2016-027.txt
- INMS_MN_2016-027_R1025.txt
- INMS_MN_2016-027_R1026.txt
- INMS_MS_2016-027_R1025_D001_S001.txt
- INMS_MS_2016-027_R1025_D001_S002.txt
- INMS_MS_2016-027_R1025_D001_S003.txt
- INMS_MS_2016-027_R1025_D001_S004.txt
- INMS_MS_2016-027_R1025_D001_S005.txt
- INMS_MS_2016-027_R1025_D001_S006.txt
- INMS_MS_2016-027_R1025_D001_S007.txt
- INMS_MS_2016-027_R1025_D001_S008.txt
- INMS_MS_2016-027_R1025_D001_S009.txt
- INMS_MS_2016-027_R1025_D001_S010.txt
- INMS_MS_2016-027_R1025_D001_S011.txt
- INMS_MS_2016-027_R1025_D001_S012.txt
- INMS_MS_2016-027_R1025_D001_S013.txt
- INMS_MS_2016-027_R1025_D001_S014.txt
- INMS_MS_2016-027_R1025_D001_S015.txt
- INMS_MS_2016-027_R1025_D001_S016.txt
- INMS_MS_2016-027_R1025_D001_S017.txt
- INMS_MS_2016-027_R1025_D001_S018.txt
- INMS_MS_2016-027_R1025_D001_S019.txt
- INMS_MS_2016-027_R1025_D001_S020.txt
- INMS_MS_2016-027_R1025_D001_S021.txt
- INMS_MS_2016-027_R1025_D001_S022.txt
- INMS_MS_2016-027_R1025_D001_S023.txt
- INMS_MS_2016-027_R1025_D001_S024.txt
- INMS_MS_2016-027_R1025_D001_S025.txt
- INMS_MS_2016-027_R1025_D001_S026.txt
- INMS_MS_2016-027_R1025_D001_S027.txt
- INMS_MS_2016-027_R1025_D001_S028.txt
- INMS_MS_2016-027_R1025_D001_S029.txt
- INMS_MS_2016-027_R1025_D001_S030.txt
- INMS_MS_2016-027_R1025_D001_S031.txt
- INMS_MS_2016-027_R1025_D001_S032.txt
- INMS_MS_2016-027_R1025_D001_S033.txt
- INMS_MS_2016-027_R1025_D001_S034.txt
- INMS_MS_2016-027_R1025_D001_S035.txt
- INMS_MS_2016-027_R1025_D001_S036.txt
- INMS_MS_2016-027_R1025_D001_S037.txt
- INMS_MS_2016-027_R1025_D001_S038.txt
- INMS_MS_2016-027_R1025_D001_S039.txt
- INMS_MS_2016-027_R1025_D001_S040.txt
- INMS_MS_2016-027_R1025_D001_S041.txt
- INMS_MS_2016-027_R1025_D001_S042.txt
- INMS_MS_2016-027_R1025_D001_S043.txt
- INMS_MS_2016-027_R1025_D001_S044.txt
- INMS_MS_2016-027_R1025_D001_S045.txt
- INMS_MS_2016-027_R1025_D001_S046.txt
- INMS_MS_2016-027_R1025_D001_S047.txt
- INMS_MS_2016-027_R1025_D001_S048.txt
- INMS_MS_2016-027_R1025_D001_S049.txt
- INMS_MS_2016-027_R1025_D001_S050.txt
- INMS_MS_2016-027_R1025_D001_S051.txt
- INMS_MS_2016-027_R1025_D001_S052.txt
- INMS_MS_2016-027_R1025_D001_S053.txt
- INMS_MS_2016-027_R1025_D001_S054.txt
- INMS_MS_2016-027_R1025_D001_S055.txt
- INMS_MS_2016-027_R1025_D001_S056.txt
- INMS_MS_2016-027_R1025_D001_S057.txt
- INMS_MS_2016-027_R1025_D001_S058.txt
- INMS_MS_2016-027_R1025_D001_S059.txt
- INMS_MS_2016-027_R1025_D001_S060.txt
- INMS_MS_2016-027_R1025_D001_S061.txt
- INMS_MS_2016-027_R1025_D001_S062.txt
- INMS_MS_2016-027_R1025_D001_S063.txt
- INMS_MS_2016-027_R1025_D001_S064.txt
- INMS_MS_2016-027_R1025_D001_S065.txt
- INMS_MS_2016-027_R1025_D001_S066.txt
- INMS_MS_2016-027_R1025_D001_S067.txt
- INMS_MS_2016-027_R1025_D001_S068.txt
- INMS_MS_2016-027_R1025_D001_S069.txt
- INMS_MS_2016-027_R1025_D001_S070.txt
- INMS_MS_2016-027_R1025_D001_S071.txt
- INMS_MS_2016-027_R1025_D001_S072.txt
- INMS_MS_2016-027_R1025_D001_S073.txt
- INMS_MS_2016-027_R1025_D001_S074.txt
- INMS_MS_2016-027_R1025_D001_S075.txt
- INMS_MS_2016-027_R1025_D001_S076.txt
- INMS_MS_2016-027_R1025_D001_S077.txt
- INMS_MS_2016-027_R1025_D001_S078.txt
- INMS_MS_2016-027_R1025_D001_S079.txt
- INMS_MS_2016-027_R1025_D001_S080.txt
- INMS_MS_2016-027_R1025_D002_S081.txt
- INMS_MS_2016-027_R1025_D002_S082.txt
- INMS_MS_2016-027_R1025_D002_S083.txt
- INMS_MS_2016-027_R1025_D002_S084.txt
- INMS_MS_2016-027_R1025_D002_S085.txt
- INMS_MS_2016-027_R1025_D002_S086.txt
- INMS_MS_2016-027_R1025_D002_S087.txt
- INMS_MS_2016-027_R1025_D002_S088.txt
- INMS_MS_2016-027_R1025_D002_S089.txt
- INMS_MS_2016-027_R1025_D002_S090.txt
- INMS_MS_2016-027_R1025_D002_S091.txt
- INMS_MS_2016-027_R1025_D002_S092.txt
- INMS_MS_2016-027_R1025_D002_S093.txt
- INMS_MS_2016-027_R1025_D002_S094.txt
- INMS_MS_2016-027_R1025_D002_S095.txt
- INMS_MS_2016-027_R1025_D002_S096.txt
- INMS_MS_2016-027_R1025_D002_S097.txt
- INMS_MS_2016-027_R1025_D002_S098.txt
- INMS_MS_2016-027_R1025_D002_S099.txt
- INMS_MS_2016-027_R1025_D002_S100.txt
- INMS_MS_2016-027_R1025_D002_S101.txt
- INMS_MS_2016-027_R1025_D002_S102.txt
- INMS_MS_2016-027_R1025_D002_S103.txt
- INMS_MS_2016-027_R1025_D002_S104.txt
- INMS_MS_2016-027_R1025_D002_S105.txt
- INMS_MS_2016-027_R1025_D002_S106.txt
- INMS_MS_2016-027_R1025_D002_S107.txt
- INMS_MS_2016-027_R1025_D002_S108.txt
- INMS_MS_2016-027_R1025_D002_S109.txt
- INMS_MS_2016-027_R1025_D002_S110.txt
- INMS_MS_2016-027_R1025_D002_S111.txt
- INMS_MS_2016-027_R1025_D002_S112.txt
- INMS_MS_2016-027_R1025_D002_S113.txt
- INMS_MS_2016-027_R1025_D002_S114.txt
- INMS_MS_2016-027_R1025_D002_S115.txt
- INMS_MS_2016-027_R1025_D002_S116.txt
- INMS_MS_2016-027_R1025_D002_S117.txt
- INMS_MS_2016-027_R1025_D002_S118.txt
- INMS_MS_2016-027_R1025_D002_S119.txt
- INMS_MS_2016-027_R1025_D002_S120.txt
- INMS_MS_2016-027_R1025_D002_S121.txt
- INMS_MS_2016-027_R1025_D002_S122.txt
- INMS_MS_2016-027_R1025_D002_S123.txt
- INMS_MS_2016-027_R1025_D002_S124.txt
- INMS_MS_2016-027_R1025_D002_S125.txt
- INMS_MS_2016-027_R1025_D002_S126.txt
- INMS_MS_2016-027_R1025_D002_S127.txt
- INMS_MS_2016-027_R1025_D002_S128.txt
- INMS_MS_2016-027_R1025_D002_S129.txt
- INMS_MS_2016-027_R1025_D002_S130.txt
- INMS_MS_2016-027_R1025_D002_S131.txt
- INMS_MS_2016-027_R1025_D002_S132.txt
- INMS_MS_2016-027_R1025_D002_S133.txt
- INMS_MS_2016-027_R1025_D002_S134.txt
- INMS_MS_2016-027_R1025_D002_S135.txt
- INMS_MS_2016-027_R1025_D002_S136.txt
- INMS_MS_2016-027_R1025_D002_S137.txt
- INMS_MS_2016-027_R1025_D002_S138.txt
- INMS_MS_2016-027_R1025_D002_S139.txt
- INMS_MS_2016-027_R1025_D002_S140.txt
- INMS_MS_2016-027_R1025_D002_S141.txt
- INMS_MS_2016-027_R1025_D002_S142.txt
- INMS_MS_2016-027_R1025_D002_S143.txt
- INMS_MS_2016-027_R1025_D002_S144.txt
- INMS_MS_2016-027_R1025_D002_S145.txt
- INMS_MS_2016-027_R1025_D002_S146.txt
- INMS_MS_2016-027_R1025_D002_S147.txt
- INMS_MS_2016-027_R1025_D002_S148.txt
- INMS_MS_2016-027_R1025_D002_S149.txt
- INMS_MS_2016-027_R1025_D002_S150.txt
- INMS_MS_2016-027_R1025_D002_S151.txt
- INMS_MS_2016-027_R1025_D002_S152.txt
- INMS_MS_2016-027_R1025_D002_S153.txt
- INMS_MS_2016-027_R1025_D002_S154.txt
- INMS_MS_2016-027_R1025_D002_S155.txt
- INMS_MS_2016-027_R1025_D002_S156.txt
- INMS_MS_2016-027_R1025_D002_S157.txt
- INMS_MS_2016-027_R1025_D002_S158.txt
- INMS_MS_2016-027_R1025_D002_S159.txt
- INMS_MS_2016-027_R1025_D002_S160.txt
- INMS_MS_2016-027_R1025_D003_S161.txt
- INMS_MS_2016-027_R1025_D003_S162.txt
- INMS_MS_2016-027_R1025_D003_S163.txt
- INMS_MS_2016-027_R1025_D003_S164.txt
- INMS_MS_2016-027_R1025_D003_S165.txt
- INMS_MS_2016-027_R1025_D003_S166.txt
- INMS_MS_2016-027_R1025_D003_S167.txt
- INMS_MS_2016-027_R1025_D003_S168.txt
- INMS_MS_2016-027_R1025_D003_S169.txt
- INMS_MS_2016-027_R1025_D003_S170.txt
- INMS_MS_2016-027_R1025_D003_S171.txt
- INMS_MS_2016-027_R1025_D003_S172.txt
- INMS_MS_2016-027_R1025_D003_S173.txt
- INMS_MS_2016-027_R1025_D003_S174.txt
- INMS_MS_2016-027_R1025_D003_S175.txt
- INMS_MS_2016-027_R1025_D003_S176.txt
- INMS_MS_2016-027_R1025_D003_S177.txt
- INMS_MS_2016-027_R1025_D003_S178.txt
- INMS_MS_2016-027_R1025_D003_S179.txt
- INMS_MS_2016-027_R1025_D003_S180.txt
- INMS_MS_2016-027_R1025_D003_S181.txt
- INMS_MS_2016-027_R1025_D003_S182.txt
- INMS_MS_2016-027_R1025_D003_S183.txt
- INMS_MS_2016-027_R1025_D003_S184.txt
- INMS_MS_2016-027_R1025_D003_S185.txt
- INMS_MS_2016-027_R1025_D003_S186.txt
- INMS_MS_2016-027_R1025_D003_S187.txt
- INMS_MS_2016-027_R1025_D003_S188.txt
- INMS_MS_2016-027_R1025_D003_S189.txt
- INMS_MS_2016-027_R1025_D003_S190.txt
- INMS_MS_2016-027_R1025_D003_S191.txt
- INMS_MS_2016-027_R1025_D003_S192.txt
- INMS_MS_2016-027_R1025_D003_S193.txt
- INMS_MS_2016-027_R1025_D003_S194.txt
- INMS_MS_2016-027_R1025_D003_S195.txt
- INMS_MS_2016-027_R1025_D003_S196.txt
- INMS_MS_2016-027_R1025_D003_S197.txt
- INMS_MS_2016-027_R1025_D003_S198.txt
- INMS_MS_2016-027_R1025_D003_S199.txt
- INMS_MS_2016-027_R1025_D003_S200.txt
- INMS_MS_2016-027_R1025_D003_S201.txt
- INMS_MS_2016-027_R1025_D003_S202.txt
- INMS_MS_2016-027_R1025_D003_S203.txt
- INMS_MS_2016-027_R1025_D003_S204.txt
- INMS_MS_2016-027_R1025_D003_S205.txt
- INMS_MS_2016-027_R1025_D003_S206.txt
- INMS_MS_2016-027_R1025_D003_S207.txt
- INMS_MS_2016-027_R1025_D003_S208.txt
- INMS_MS_2016-027_R1025_D003_S209.txt
- INMS_MS_2016-027_R1025_D003_S210.txt
- INMS_MS_2016-027_R1025_D003_S211.txt
- INMS_MS_2016-027_R1025_D003_S212.txt
- INMS_MS_2016-027_R1025_D003_S213.txt
- INMS_MS_2016-027_R1025_D003_S214.txt
- INMS_MS_2016-027_R1025_D003_S215.txt
- INMS_MS_2016-027_R1025_D003_S216.txt
- INMS_MS_2016-027_R1025_D003_S217.txt
- INMS_MS_2016-027_R1025_D003_S218.txt
- INMS_MS_2016-027_R1025_D003_S219.txt
- INMS_MS_2016-027_R1025_D003_S220.txt
- INMS_MS_2016-027_R1025_D003_S221.txt
- INMS_MS_2016-027_R1025_D003_S222.txt
- INMS_MS_2016-027_R1025_D003_S223.txt
- INMS_MS_2016-027_R1025_D003_S224.txt
- INMS_MS_2016-027_R1025_D003_S225.txt
- INMS_MS_2016-027_R1025_D003_S226.txt
- INMS_MS_2016-027_R1025_D003_S227.txt
- INMS_MS_2016-027_R1025_D003_S228.txt
- INMS_MS_2016-027_R1025_D003_S229.txt
- INMS_MS_2016-027_R1025_D003_S230.txt
- INMS_MS_2016-027_R1025_D003_S231.txt
- INMS_MS_2016-027_R1025_D003_S232.txt
- INMS_MS_2016-027_R1025_D003_S233.txt
- INMS_MS_2016-027_R1025_D003_S234.txt
- INMS_MS_2016-027_R1025_D003_S235.txt
- INMS_MS_2016-027_R1025_D003_S236.txt
- INMS_MS_2016-027_R1025_D003_S237.txt
- INMS_MS_2016-027_R1025_D003_S238.txt
- INMS_MS_2016-027_R1025_D003_S239.txt
- INMS_MS_2016-027_R1025_D003_S240.txt
- INMS_MS_2016-027_R1025_D004_S241.txt
- INMS_MS_2016-027_R1025_D004_S242.txt
- INMS_MS_2016-027_R1025_D004_S243.txt
- INMS_MS_2016-027_R1025_D004_S244.txt
- INMS_MS_2016-027_R1025_D004_S245.txt
- INMS_MS_2016-027_R1025_D004_S246.txt
- INMS_MS_2016-027_R1025_D004_S247.txt
- INMS_MS_2016-027_R1025_D004_S248.txt
- INMS_MS_2016-027_R1025_D004_S249.txt
- INMS_MS_2016-027_R1025_D004_S250.txt
- INMS_MS_2016-027_R1025_D004_S251.txt
- INMS_MS_2016-027_R1025_D004_S252.txt
- INMS_MS_2016-027_R1025_D004_S253.txt
- INMS_MS_2016-027_R1025_D004_S254.txt
- INMS_MS_2016-027_R1025_D004_S255.txt
- INMS_MS_2016-027_R1025_D004_S256.txt
- INMS_MS_2016-027_R1025_D004_S257.txt
- INMS_MS_2016-027_R1025_D004_S258.txt
- INMS_MS_2016-027_R1025_D004_S259.txt
- INMS_MS_2016-027_R1025_D004_S260.txt
- INMS_MS_2016-027_R1025_D004_S261.txt
- INMS_MS_2016-027_R1025_D004_S262.txt
- INMS_MS_2016-027_R1025_D004_S263.txt
- INMS_MS_2016-027_R1025_D004_S264.txt
- INMS_MS_2016-027_R1025_D004_S265.txt
- INMS_MS_2016-027_R1025_D004_S266.txt
- INMS_MS_2016-027_R1025_D004_S267.txt
- INMS_MS_2016-027_R1025_D004_S268.txt
- INMS_MS_2016-027_R1025_D004_S269.txt
- INMS_MS_2016-027_R1025_D004_S270.txt
- INMS_MS_2016-027_R1025_D004_S271.txt
- INMS_MS_2016-027_R1025_D004_S272.txt
- INMS_MS_2016-027_R1025_D004_S273.txt
- INMS_MS_2016-027_R1025_D004_S274.txt
- INMS_MS_2016-027_R1025_D004_S275.txt
- INMS_MS_2016-027_R1025_D004_S276.txt
- INMS_MS_2016-027_R1025_D004_S277.txt
- INMS_MS_2016-027_R1025_D004_S278.txt
- INMS_MS_2016-027_R1025_D004_S279.txt
- INMS_MS_2016-027_R1025_D004_S280.txt
- INMS_MS_2016-027_R1025_D004_S281.txt
- INMS_MS_2016-027_R1025_D004_S282.txt
- INMS_MS_2016-027_R1025_D004_S283.txt
- INMS_MS_2016-027_R1025_D004_S284.txt
- INMS_MS_2016-027_R1025_D004_S285.txt
- INMS_MS_2016-027_R1025_D004_S286.txt
- INMS_MS_2016-027_R1025_D004_S287.txt
- INMS_MS_2016-027_R1025_D004_S288.txt
- INMS_MS_2016-027_R1025_D004_S289.txt
- INMS_MS_2016-027_R1025_D004_S290.txt
- INMS_MS_2016-027_R1025_D004_S291.txt
- INMS_MS_2016-027_R1025_D004_S292.txt
- INMS_MS_2016-027_R1025_D004_S293.txt
- INMS_MS_2016-027_R1025_D004_S294.txt
- INMS_MS_2016-027_R1025_D004_S295.txt
- INMS_MS_2016-027_R1025_D004_S296.txt
- INMS_MS_2016-027_R1025_D004_S297.txt
- INMS_MS_2016-027_R1025_D004_S298.txt
- INMS_MS_2016-027_R1025_D004_S299.txt
- INMS_MS_2016-027_R1025_D004_S300.txt
- INMS_MS_2016-027_R1025_D004_S301.txt
- INMS_MS_2016-027_R1025_D004_S302.txt
- INMS_MS_2016-027_R1025_D004_S303.txt
- INMS_MS_2016-027_R1025_D004_S304.txt
- INMS_MS_2016-027_R1025_D004_S305.txt
- INMS_MS_2016-027_R1025_D004_S306.txt
- INMS_MS_2016-027_R1025_D004_S307.txt
- INMS_MS_2016-027_R1025_D004_S308.txt
- INMS_MS_2016-027_R1025_D004_S309.txt
- INMS_MS_2016-027_R1025_D004_S310.txt
- INMS_MS_2016-027_R1025_D004_S311.txt
- INMS_MS_2016-027_R1025_D004_S312.txt
- INMS_MS_2016-027_R1025_D004_S313.txt
- INMS_MS_2016-027_R1025_D004_S314.txt
- INMS_MS_2016-027_R1025_D004_S315.txt
- INMS_MS_2016-027_R1025_D004_S316.txt
- INMS_MS_2016-027_R1025_D004_S317.txt
- INMS_MS_2016-027_R1025_D004_S318.txt
- INMS_MS_2016-027_R1025_D004_S319.txt
- INMS_MS_2016-027_R1025_D004_S320.txt
- INMS_MS_2016-027_R1025_D005_S321.txt
- INMS_MS_2016-027_R1025_D005_S322.txt
- INMS_MS_2016-027_R1025_D005_S323.txt
- INMS_MS_2016-027_R1025_D005_S324.txt
- INMS_MS_2016-027_R1025_D005_S325.txt
- INMS_MS_2016-027_R1025_D005_S326.txt
- INMS_MS_2016-027_R1025_D005_S327.txt
- INMS_MS_2016-027_R1025_D005_S328.txt
- INMS_MS_2016-027_R1025_D005_S329.txt
- INMS_MS_2016-027_R1025_D005_S330.txt
- INMS_MS_2016-027_R1025_D005_S331.txt
- INMS_MS_2016-027_R1025_D005_S332.txt
- INMS_MS_2016-027_R1025_D005_S333.txt
- INMS_MS_2016-027_R1025_D005_S334.txt
- INMS_MS_2016-027_R1025_D005_S335.txt
- INMS_MS_2016-027_R1025_D005_S336.txt
- INMS_MS_2016-027_R1025_D005_S337.txt
- INMS_MS_2016-027_R1025_D005_S338.txt
- INMS_MS_2016-027_R1025_D005_S339.txt
- INMS_MS_2016-027_R1025_D005_S340.txt
- INMS_MS_2016-027_R1025_D005_S341.txt
- INMS_MS_2016-027_R1025_D005_S342.txt
- INMS_MS_2016-027_R1025_D005_S343.txt
- INMS_MS_2016-027_R1025_D005_S344.txt
- INMS_MS_2016-027_R1025_D005_S345.txt
- INMS_MS_2016-027_R1025_D005_S346.txt
- INMS_MS_2016-027_R1025_D005_S347.txt
- INMS_MS_2016-027_R1025_D005_S348.txt
- INMS_MS_2016-027_R1025_D005_S349.txt
- INMS_MS_2016-027_R1025_D005_S350.txt
- INMS_MS_2016-027_R1025_D005_S351.txt
- INMS_MS_2016-027_R1025_D005_S352.txt
- INMS_MS_2016-027_R1025_D005_S353.txt
- INMS_MS_2016-027_R1025_D005_S354.txt
- INMS_MS_2016-027_R1025_D005_S355.txt
- INMS_MS_2016-027_R1025_D005_S356.txt
- INMS_MS_2016-027_R1025_D005_S357.txt
- INMS_MS_2016-027_R1025_D005_S358.txt
- INMS_MS_2016-027_R1025_D005_S359.txt
- INMS_MS_2016-027_R1025_D005_S360.txt
- INMS_MS_2016-027_R1025_D005_S361.txt
- INMS_MS_2016-027_R1025_D005_S362.txt
- INMS_MS_2016-027_R1025_D005_S363.txt
- INMS_MS_2016-027_R1025_D005_S364.txt
- INMS_MS_2016-027_R1025_D005_S365.txt
- INMS_MS_2016-027_R1025_D005_S366.txt
- INMS_MS_2016-027_R1025_D005_S367.txt
- INMS_MS_2016-027_R1025_D005_S368.txt
- INMS_MS_2016-027_R1025_D005_S369.txt
- INMS_MS_2016-027_R1025_D005_S370.txt
- INMS_MS_2016-027_R1025_D005_S371.txt
- INMS_MS_2016-027_R1025_D005_S372.txt
- INMS_MS_2016-027_R1025_D005_S373.txt
- INMS_MS_2016-027_R1025_D005_S374.txt
- INMS_MS_2016-027_R1025_D005_S375.txt
- INMS_MS_2016-027_R1025_D005_S376.txt
- INMS_MS_2016-027_R1025_D005_S377.txt
- INMS_MS_2016-027_R1025_D005_S378.txt
- INMS_MS_2016-027_R1025_D005_S379.txt
- INMS_MS_2016-027_R1025_D005_S380.txt
- INMS_MS_2016-027_R1025_D005_S381.txt
- INMS_MS_2016-027_R1025_D005_S382.txt
- INMS_MS_2016-027_R1025_D005_S383.txt
- INMS_MS_2016-027_R1025_D005_S384.txt
- INMS_MS_2016-027_R1025_D005_S385.txt
- INMS_MS_2016-027_R1025_D005_S386.txt
- INMS_MS_2016-027_R1025_D005_S387.txt
- INMS_MS_2016-027_R1025_D005_S388.txt
- INMS_MS_2016-027_R1025_D005_S389.txt
- INMS_MS_2016-027_R1025_D005_S390.txt
- INMS_MS_2016-027_R1025_D005_S391.txt
- INMS_MS_2016-027_R1025_D005_S392.txt
- INMS_MS_2016-027_R1025_D005_S393.txt
- INMS_MS_2016-027_R1025_D005_S394.txt
- INMS_MS_2016-027_R1025_D005_S395.txt
- INMS_MS_2016-027_R1025_D005_S396.txt
- INMS_MS_2016-027_R1025_D005_S397.txt
- INMS_MS_2016-027_R1025_D005_S398.txt
- INMS_MS_2016-027_R1025_D005_S399.txt
- INMS_MS_2016-027_R1025_D005_S400.txt
- INMS_MS_2016-027_R1025_D006_S401.txt
- INMS_MS_2016-027_R1025_D006_S402.txt
- INMS_MS_2016-027_R1025_D006_S403.txt
- INMS_MS_2016-027_R1025_D006_S404.txt
- INMS_MS_2016-027_R1025_D006_S405.txt
- INMS_MS_2016-027_R1025_D006_S406.txt
- INMS_MS_2016-027_R1025_D006_S407.txt
- INMS_MS_2016-027_R1025_D006_S408.txt
- INMS_MS_2016-027_R1025_D006_S409.txt
- INMS_MS_2016-027_R1025_D006_S410.txt
- INMS_MS_2016-027_R1025_D006_S411.txt
- INMS_MS_2016-027_R1025_D006_S412.txt
- INMS_MS_2016-027_R1025_D006_S413.txt
- INMS_MS_2016-027_R1025_D006_S414.txt
- INMS_MS_2016-027_R1025_D006_S415.txt
- INMS_MS_2016-027_R1025_D006_S416.txt
- INMS_MS_2016-027_R1025_D006_S417.txt
- INMS_MS_2016-027_R1025_D006_S418.txt
- INMS_MS_2016-027_R1025_D006_S419.txt
- INMS_MS_2016-027_R1025_D006_S420.txt
- INMS_MS_2016-027_R1025_D006_S421.txt
- INMS_MS_2016-027_R1025_D006_S422.txt
- INMS_MS_2016-027_R1025_D006_S423.txt
- INMS_MS_2016-027_R1025_D006_S424.txt
- INMS_MS_2016-027_R1025_D006_S425.txt
- INMS_MS_2016-027_R1025_D006_S426.txt
- INMS_MS_2016-027_R1025_D006_S427.txt
- INMS_MS_2016-027_R1025_D006_S428.txt
- INMS_MS_2016-027_R1025_D006_S429.txt
- INMS_MS_2016-027_R1025_D006_S430.txt
- INMS_MS_2016-027_R1025_D006_S431.txt
- INMS_MS_2016-027_R1025_D006_S432.txt
- INMS_MS_2016-027_R1025_D006_S433.txt
- INMS_MS_2016-027_R1025_D006_S434.txt
- INMS_MS_2016-027_R1025_D006_S435.txt
- INMS_MS_2016-027_R1025_D006_S436.txt
- INMS_MS_2016-027_R1025_D006_S437.txt
- INMS_MS_2016-027_R1025_D006_S438.txt
- INMS_MS_2016-027_R1025_D006_S439.txt
- INMS_MS_2016-027_R1025_D006_S440.txt
- INMS_MS_2016-027_R1025_D006_S441.txt
- INMS_MS_2016-027_R1025_D006_S442.txt
- INMS_MS_2016-027_R1025_D006_S443.txt
- INMS_MS_2016-027_R1025_D006_S444.txt
- INMS_MS_2016-027_R1025_D006_S445.txt
- INMS_MS_2016-027_R1025_D006_S446.txt
- INMS_MS_2016-027_R1025_D006_S447.txt
- INMS_MS_2016-027_R1025_D006_S448.txt
- INMS_MS_2016-027_R1025_D006_S449.txt
- INMS_MS_2016-027_R1025_D006_S450.txt
- INMS_MS_2016-027_R1025_D006_S451.txt
- INMS_MS_2016-027_R1025_D006_S452.txt
- INMS_MS_2016-027_R1025_D006_S453.txt
- INMS_MS_2016-027_R1025_D006_S454.txt
- INMS_MS_2016-027_R1025_D006_S455.txt
- INMS_MS_2016-027_R1025_D006_S456.txt
- INMS_MS_2016-027_R1025_D006_S457.txt
- INMS_MS_2016-027_R1025_D006_S458.txt
- INMS_MS_2016-027_R1025_D006_S459.txt
- INMS_MS_2016-027_R1025_D006_S460.txt
- INMS_MS_2016-027_R1025_D006_S461.txt
- INMS_MS_2016-027_R1025_D006_S462.txt
- INMS_MS_2016-027_R1025_D006_S463.txt
- INMS_MS_2016-027_R1025_D006_S464.txt
- INMS_MS_2016-027_R1025_D006_S465.txt
- INMS_MS_2016-027_R1025_D006_S466.txt
- INMS_MS_2016-027_R1025_D006_S467.txt
- INMS_MS_2016-027_R1025_D006_S468.txt
- INMS_MS_2016-027_R1025_D006_S469.txt
- INMS_MS_2016-027_R1025_D006_S470.txt
- INMS_MS_2016-027_R1025_D006_S471.txt
- INMS_MS_2016-027_R1025_D006_S472.txt
- INMS_MS_2016-027_R1025_D006_S473.txt
- INMS_MS_2016-027_R1025_D006_S474.txt
- INMS_MS_2016-027_R1025_D006_S475.txt
- INMS_MS_2016-027_R1025_D006_S476.txt
- INMS_MS_2016-027_R1025_D006_S477.txt
- INMS_MS_2016-027_R1025_D006_S478.txt
- INMS_MS_2016-027_R1025_D006_S479.txt
- INMS_MS_2016-027_R1025_D006_S480.txt
- INMS_JN_2016-028_R1026.txt
- INMS_LG_2016-028.txt
- INMS_MN_2016-028_R1026.txt
- INMS_MS_2016-028_R1026_D000_S161.txt
- INMS_MS_2016-028_R1026_D000_S162.txt
- INMS_MS_2016-028_R1026_D000_S163.txt
- INMS_MS_2016-028_R1026_D001_S001.txt
- INMS_MS_2016-028_R1026_D001_S002.txt
- INMS_MS_2016-028_R1026_D001_S003.txt
- INMS_MS_2016-028_R1026_D001_S004.txt
- INMS_MS_2016-028_R1026_D001_S005.txt
- INMS_MS_2016-028_R1026_D001_S006.txt
- INMS_MS_2016-028_R1026_D001_S007.txt
- INMS_MS_2016-028_R1026_D001_S008.txt
- INMS_MS_2016-028_R1026_D001_S009.txt
- INMS_MS_2016-028_R1026_D001_S010.txt
- INMS_MS_2016-028_R1026_D001_S011.txt
- INMS_MS_2016-028_R1026_D001_S012.txt
- INMS_MS_2016-028_R1026_D001_S013.txt
- INMS_MS_2016-028_R1026_D001_S014.txt
- INMS_MS_2016-028_R1026_D001_S015.txt
- INMS_MS_2016-028_R1026_D001_S016.txt
- INMS_MS_2016-028_R1026_D001_S017.txt
- INMS_MS_2016-028_R1026_D001_S018.txt
- INMS_MS_2016-028_R1026_D001_S019.txt
- INMS_MS_2016-028_R1026_D001_S020.txt
- INMS_MS_2016-028_R1026_D001_S021.txt
- INMS_MS_2016-028_R1026_D001_S022.txt
- INMS_MS_2016-028_R1026_D001_S023.txt
- INMS_MS_2016-028_R1026_D001_S024.txt
- INMS_MS_2016-028_R1026_D001_S025.txt
- INMS_MS_2016-028_R1026_D001_S026.txt
- INMS_MS_2016-028_R1026_D001_S027.txt
- INMS_MS_2016-028_R1026_D001_S028.txt
- INMS_MS_2016-028_R1026_D001_S029.txt
- INMS_MS_2016-028_R1026_D001_S030.txt
- INMS_MS_2016-028_R1026_D001_S031.txt
- INMS_MS_2016-028_R1026_D001_S032.txt
- INMS_MS_2016-028_R1026_D001_S033.txt
- INMS_MS_2016-028_R1026_D001_S034.txt
- INMS_MS_2016-028_R1026_D001_S035.txt
- INMS_MS_2016-028_R1026_D001_S036.txt
- INMS_MS_2016-028_R1026_D001_S037.txt
- INMS_MS_2016-028_R1026_D001_S038.txt
- INMS_MS_2016-028_R1026_D001_S039.txt
- INMS_MS_2016-028_R1026_D001_S040.txt
- INMS_MS_2016-028_R1026_D001_S041.txt
- INMS_MS_2016-028_R1026_D001_S042.txt
- INMS_MS_2016-028_R1026_D001_S043.txt
- INMS_MS_2016-028_R1026_D001_S044.txt
- INMS_MS_2016-028_R1026_D001_S045.txt
- INMS_MS_2016-028_R1026_D001_S046.txt
- INMS_MS_2016-028_R1026_D001_S047.txt
- INMS_MS_2016-028_R1026_D001_S048.txt
- INMS_MS_2016-028_R1026_D001_S049.txt
- INMS_MS_2016-028_R1026_D001_S050.txt
- INMS_MS_2016-028_R1026_D001_S051.txt
- INMS_MS_2016-028_R1026_D001_S052.txt
- INMS_MS_2016-028_R1026_D001_S053.txt
- INMS_MS_2016-028_R1026_D001_S054.txt
- INMS_MS_2016-028_R1026_D001_S055.txt
- INMS_MS_2016-028_R1026_D001_S056.txt
- INMS_MS_2016-028_R1026_D001_S057.txt
- INMS_MS_2016-028_R1026_D001_S058.txt
- INMS_MS_2016-028_R1026_D001_S059.txt
- INMS_MS_2016-028_R1026_D001_S060.txt
- INMS_MS_2016-028_R1026_D001_S061.txt
- INMS_MS_2016-028_R1026_D001_S062.txt
- INMS_MS_2016-028_R1026_D001_S063.txt
- INMS_MS_2016-028_R1026_D001_S064.txt
- INMS_MS_2016-028_R1026_D001_S065.txt
- INMS_MS_2016-028_R1026_D001_S066.txt
- INMS_MS_2016-028_R1026_D001_S067.txt
- INMS_MS_2016-028_R1026_D001_S068.txt
- INMS_MS_2016-028_R1026_D001_S069.txt
- INMS_MS_2016-028_R1026_D001_S070.txt
- INMS_MS_2016-028_R1026_D001_S071.txt
- INMS_MS_2016-028_R1026_D001_S072.txt
- INMS_MS_2016-028_R1026_D001_S073.txt
- INMS_MS_2016-028_R1026_D001_S074.txt
- INMS_MS_2016-028_R1026_D001_S075.txt
- INMS_MS_2016-028_R1026_D001_S076.txt
- INMS_MS_2016-028_R1026_D001_S077.txt
- INMS_MS_2016-028_R1026_D001_S078.txt
- INMS_MS_2016-028_R1026_D001_S079.txt
- INMS_MS_2016-028_R1026_D001_S080.txt
- INMS_MS_2016-028_R1026_D002_S081.txt
- INMS_MS_2016-028_R1026_D002_S082.txt
- INMS_MS_2016-028_R1026_D002_S083.txt
- INMS_MS_2016-028_R1026_D002_S084.txt
- INMS_MS_2016-028_R1026_D002_S085.txt
- INMS_MS_2016-028_R1026_D002_S086.txt
- INMS_MS_2016-028_R1026_D002_S087.txt
- INMS_MS_2016-028_R1026_D002_S088.txt
- INMS_MS_2016-028_R1026_D002_S089.txt
- INMS_MS_2016-028_R1026_D002_S090.txt
- INMS_MS_2016-028_R1026_D002_S091.txt
- INMS_MS_2016-028_R1026_D002_S092.txt
- INMS_MS_2016-028_R1026_D002_S093.txt
- INMS_MS_2016-028_R1026_D002_S094.txt
- INMS_MS_2016-028_R1026_D002_S095.txt
- INMS_MS_2016-028_R1026_D002_S096.txt
- INMS_MS_2016-028_R1026_D002_S097.txt
- INMS_MS_2016-028_R1026_D002_S098.txt
- INMS_MS_2016-028_R1026_D002_S099.txt
- INMS_MS_2016-028_R1026_D002_S100.txt
- INMS_MS_2016-028_R1026_D002_S101.txt
- INMS_MS_2016-028_R1026_D002_S102.txt
- INMS_MS_2016-028_R1026_D002_S103.txt
- INMS_MS_2016-028_R1026_D002_S104.txt
- INMS_MS_2016-028_R1026_D002_S105.txt
- INMS_MS_2016-028_R1026_D002_S106.txt
- INMS_MS_2016-028_R1026_D002_S107.txt
- INMS_MS_2016-028_R1026_D002_S108.txt
- INMS_MS_2016-028_R1026_D002_S109.txt
- INMS_MS_2016-028_R1026_D002_S110.txt
- INMS_MS_2016-028_R1026_D002_S111.txt
- INMS_MS_2016-028_R1026_D002_S112.txt
- INMS_MS_2016-028_R1026_D002_S113.txt
- INMS_MS_2016-028_R1026_D002_S114.txt
- INMS_MS_2016-028_R1026_D002_S115.txt
- INMS_MS_2016-028_R1026_D002_S116.txt
- INMS_MS_2016-028_R1026_D002_S117.txt
- INMS_MS_2016-028_R1026_D002_S118.txt
- INMS_MS_2016-028_R1026_D002_S119.txt
- INMS_MS_2016-028_R1026_D002_S120.txt
- INMS_MS_2016-028_R1026_D002_S121.txt
- INMS_MS_2016-028_R1026_D002_S122.txt
- INMS_MS_2016-028_R1026_D002_S123.txt
- INMS_MS_2016-028_R1026_D002_S124.txt
- INMS_MS_2016-028_R1026_D002_S125.txt
- INMS_MS_2016-028_R1026_D002_S126.txt
- INMS_MS_2016-028_R1026_D002_S127.txt
- INMS_MS_2016-028_R1026_D002_S128.txt
- INMS_MS_2016-028_R1026_D002_S129.txt
- INMS_MS_2016-028_R1026_D002_S130.txt
- INMS_MS_2016-028_R1026_D002_S131.txt
- INMS_MS_2016-028_R1026_D002_S132.txt
- INMS_MS_2016-028_R1026_D002_S133.txt
- INMS_MS_2016-028_R1026_D002_S134.txt
- INMS_MS_2016-028_R1026_D002_S135.txt
- INMS_MS_2016-028_R1026_D002_S136.txt
- INMS_MS_2016-028_R1026_D002_S137.txt
- INMS_MS_2016-028_R1026_D002_S138.txt
- INMS_MS_2016-028_R1026_D002_S139.txt
- INMS_MS_2016-028_R1026_D002_S140.txt
- INMS_MS_2016-028_R1026_D002_S141.txt
- INMS_MS_2016-028_R1026_D002_S142.txt
- INMS_MS_2016-028_R1026_D002_S143.txt
- INMS_MS_2016-028_R1026_D002_S144.txt
- INMS_MS_2016-028_R1026_D002_S145.txt
- INMS_MS_2016-028_R1026_D002_S146.txt
- INMS_MS_2016-028_R1026_D002_S147.txt
- INMS_MS_2016-028_R1026_D002_S148.txt
- INMS_MS_2016-028_R1026_D002_S149.txt
- INMS_MS_2016-028_R1026_D002_S150.txt
- INMS_MS_2016-028_R1026_D002_S151.txt
- INMS_MS_2016-028_R1026_D002_S152.txt
- INMS_MS_2016-028_R1026_D002_S153.txt
- INMS_MS_2016-028_R1026_D002_S154.txt
- INMS_MS_2016-028_R1026_D002_S155.txt
- INMS_MS_2016-028_R1026_D002_S156.txt
- INMS_MS_2016-028_R1026_D002_S157.txt
- INMS_MS_2016-028_R1026_D002_S158.txt
- INMS_MS_2016-028_R1026_D002_S159.txt
- INMS_MS_2016-028_R1026_D002_S160.txt
- INMS_MS_2016-028_R1026_D003_S164.txt
- INMS_MS_2016-028_R1026_D003_S165.txt
- INMS_MS_2016-028_R1026_D003_S166.txt
- INMS_MS_2016-028_R1026_D003_S167.txt
- INMS_MS_2016-028_R1026_D003_S168.txt
- INMS_MS_2016-028_R1026_D003_S169.txt
- INMS_MS_2016-028_R1026_D003_S170.txt
- INMS_MS_2016-028_R1026_D003_S171.txt
- INMS_MS_2016-028_R1026_D003_S172.txt
- INMS_MS_2016-028_R1026_D003_S173.txt
- INMS_MS_2016-028_R1026_D003_S174.txt
- INMS_MS_2016-028_R1026_D003_S175.txt
- INMS_MS_2016-028_R1026_D003_S176.txt
- INMS_MS_2016-028_R1026_D003_S177.txt
- INMS_MS_2016-028_R1026_D003_S178.txt
- INMS_MS_2016-028_R1026_D003_S179.txt
- INMS_MS_2016-028_R1026_D003_S180.txt
- INMS_MS_2016-028_R1026_D003_S181.txt
- INMS_MS_2016-028_R1026_D003_S182.txt
- INMS_MS_2016-028_R1026_D003_S183.txt
- INMS_MS_2016-028_R1026_D003_S184.txt
- INMS_MS_2016-028_R1026_D003_S185.txt
- INMS_MS_2016-028_R1026_D003_S186.txt
- INMS_MS_2016-028_R1026_D003_S187.txt
- INMS_MS_2016-028_R1026_D003_S188.txt
- INMS_MS_2016-028_R1026_D003_S189.txt
- INMS_MS_2016-028_R1026_D003_S190.txt
- INMS_MS_2016-028_R1026_D003_S191.txt
- INMS_MS_2016-028_R1026_D003_S192.txt
- INMS_MS_2016-028_R1026_D003_S193.txt
- INMS_MS_2016-028_R1026_D003_S194.txt
- INMS_MS_2016-028_R1026_D003_S195.txt
- INMS_MS_2016-028_R1026_D003_S196.txt
- INMS_MS_2016-028_R1026_D003_S197.txt
- INMS_MS_2016-028_R1026_D003_S198.txt
- INMS_MS_2016-028_R1026_D003_S199.txt
- INMS_MS_2016-028_R1026_D003_S200.txt
- INMS_MS_2016-028_R1026_D003_S201.txt
- INMS_MS_2016-028_R1026_D003_S202.txt
- INMS_MS_2016-028_R1026_D003_S203.txt
- INMS_MS_2016-028_R1026_D003_S204.txt
- INMS_MS_2016-028_R1026_D003_S205.txt
- INMS_MS_2016-028_R1026_D003_S206.txt
- INMS_MS_2016-028_R1026_D003_S207.txt
- INMS_MS_2016-028_R1026_D003_S208.txt
- INMS_MS_2016-028_R1026_D003_S209.txt
- INMS_MS_2016-028_R1026_D003_S210.txt
- INMS_MS_2016-028_R1026_D003_S211.txt
- INMS_MS_2016-028_R1026_D003_S212.txt
- INMS_MS_2016-028_R1026_D003_S213.txt
- INMS_MS_2016-028_R1026_D003_S214.txt
- INMS_MS_2016-028_R1026_D003_S215.txt
- INMS_MS_2016-028_R1026_D003_S216.txt
- INMS_MS_2016-028_R1026_D003_S217.txt
- INMS_MS_2016-028_R1026_D003_S218.txt
- INMS_MS_2016-028_R1026_D003_S219.txt
- INMS_MS_2016-028_R1026_D003_S220.txt
- INMS_MS_2016-028_R1026_D003_S221.txt
- INMS_MS_2016-028_R1026_D003_S222.txt
- INMS_MS_2016-028_R1026_D003_S223.txt
- INMS_MS_2016-028_R1026_D003_S224.txt
- INMS_MS_2016-028_R1026_D003_S225.txt
- INMS_MS_2016-028_R1026_D003_S226.txt
- INMS_MS_2016-028_R1026_D003_S227.txt
- INMS_MS_2016-028_R1026_D003_S228.txt
- INMS_MS_2016-028_R1026_D003_S229.txt
- INMS_MS_2016-028_R1026_D003_S230.txt
- INMS_MS_2016-028_R1026_D003_S231.txt
- INMS_MS_2016-028_R1026_D003_S232.txt
- INMS_MS_2016-028_R1026_D003_S233.txt
- INMS_MS_2016-028_R1026_D003_S234.txt
- INMS_MS_2016-028_R1026_D003_S235.txt
- INMS_MS_2016-028_R1026_D003_S236.txt
- INMS_MS_2016-028_R1026_D003_S237.txt
- INMS_MS_2016-028_R1026_D003_S238.txt
- INMS_MS_2016-028_R1026_D003_S239.txt
- INMS_MS_2016-028_R1026_D003_S240.txt
- INMS_MS_2016-028_R1026_D003_S241.txt
- INMS_MS_2016-028_R1026_D003_S242.txt
- INMS_MS_2016-028_R1026_D003_S243.txt
- INMS_MS_2016-028_R1026_D004_S244.txt
- INMS_MS_2016-028_R1026_D004_S245.txt
- INMS_MS_2016-028_R1026_D004_S246.txt
- INMS_MS_2016-028_R1026_D004_S247.txt
- INMS_MS_2016-028_R1026_D004_S248.txt
- INMS_MS_2016-028_R1026_D004_S249.txt
- INMS_MS_2016-028_R1026_D004_S250.txt
- INMS_MS_2016-028_R1026_D004_S251.txt
- INMS_MS_2016-028_R1026_D004_S252.txt
- INMS_MS_2016-028_R1026_D004_S253.txt
- INMS_MS_2016-028_R1026_D004_S254.txt
- INMS_MS_2016-028_R1026_D004_S255.txt
- INMS_MS_2016-028_R1026_D004_S256.txt
- INMS_MS_2016-028_R1026_D004_S257.txt
- INMS_MS_2016-028_R1026_D004_S258.txt
- INMS_MS_2016-028_R1026_D004_S259.txt
- INMS_MS_2016-028_R1026_D004_S260.txt
- INMS_MS_2016-028_R1026_D004_S261.txt
- INMS_MS_2016-028_R1026_D004_S262.txt
- INMS_MS_2016-028_R1026_D004_S263.txt
- INMS_MS_2016-028_R1026_D004_S264.txt
- INMS_MS_2016-028_R1026_D004_S265.txt
- INMS_MS_2016-028_R1026_D004_S266.txt
- INMS_MS_2016-028_R1026_D004_S267.txt
- INMS_MS_2016-028_R1026_D004_S268.txt
- INMS_MS_2016-028_R1026_D004_S269.txt
- INMS_MS_2016-028_R1026_D004_S270.txt
- INMS_MS_2016-028_R1026_D004_S271.txt
- INMS_MS_2016-028_R1026_D004_S272.txt
- INMS_MS_2016-028_R1026_D004_S273.txt
- INMS_MS_2016-028_R1026_D004_S274.txt
- INMS_MS_2016-028_R1026_D004_S275.txt
- INMS_MS_2016-028_R1026_D004_S276.txt
- INMS_MS_2016-028_R1026_D004_S277.txt
- INMS_MS_2016-028_R1026_D004_S278.txt
- INMS_MS_2016-028_R1026_D004_S279.txt
- INMS_MS_2016-028_R1026_D004_S280.txt
- INMS_MS_2016-028_R1026_D004_S281.txt
- INMS_MS_2016-028_R1026_D004_S282.txt
- INMS_MS_2016-028_R1026_D004_S283.txt
- INMS_MS_2016-028_R1026_D004_S284.txt
- INMS_MS_2016-028_R1026_D004_S285.txt
- INMS_MS_2016-028_R1026_D004_S286.txt
- INMS_MS_2016-028_R1026_D004_S287.txt
- INMS_MS_2016-028_R1026_D004_S288.txt
- INMS_MS_2016-028_R1026_D004_S289.txt
- INMS_MS_2016-028_R1026_D004_S290.txt
- INMS_MS_2016-028_R1026_D004_S291.txt
- INMS_MS_2016-028_R1026_D004_S292.txt
- INMS_MS_2016-028_R1026_D004_S293.txt
- INMS_MS_2016-028_R1026_D004_S294.txt
- INMS_MS_2016-028_R1026_D004_S295.txt
- INMS_MS_2016-028_R1026_D004_S296.txt
- INMS_MS_2016-028_R1026_D004_S297.txt
- INMS_MS_2016-028_R1026_D004_S298.txt
- INMS_MS_2016-028_R1026_D004_S299.txt
- INMS_MS_2016-028_R1026_D004_S300.txt
- INMS_MS_2016-028_R1026_D004_S301.txt
- INMS_MS_2016-028_R1026_D004_S302.txt
- INMS_MS_2016-028_R1026_D004_S303.txt
- INMS_MS_2016-028_R1026_D004_S304.txt
- INMS_MS_2016-028_R1026_D004_S305.txt
- INMS_MS_2016-028_R1026_D004_S306.txt
- INMS_MS_2016-028_R1026_D004_S307.txt
- INMS_MS_2016-028_R1026_D004_S308.txt
- INMS_MS_2016-028_R1026_D004_S309.txt
- INMS_MS_2016-028_R1026_D004_S310.txt
- INMS_MS_2016-028_R1026_D004_S311.txt
- INMS_MS_2016-028_R1026_D004_S312.txt
- INMS_MS_2016-028_R1026_D004_S313.txt
- INMS_MS_2016-028_R1026_D004_S314.txt
- INMS_MS_2016-028_R1026_D004_S315.txt
- INMS_MS_2016-028_R1026_D004_S316.txt
- INMS_MS_2016-028_R1026_D004_S317.txt
- INMS_MS_2016-028_R1026_D004_S318.txt
- INMS_MS_2016-028_R1026_D004_S319.txt
- INMS_MS_2016-028_R1026_D004_S320.txt
- INMS_MS_2016-028_R1026_D004_S321.txt
- INMS_MS_2016-028_R1026_D004_S322.txt
- INMS_MS_2016-028_R1026_D004_S323.txt
- INMS_MS_2016-028_R1026_D005_S324.txt
- INMS_MS_2016-028_R1026_D005_S325.txt
- INMS_MS_2016-028_R1026_D005_S326.txt
- INMS_MS_2016-028_R1026_D005_S327.txt
- INMS_MS_2016-028_R1026_D005_S328.txt
- INMS_MS_2016-028_R1026_D005_S329.txt
- INMS_MS_2016-028_R1026_D005_S330.txt
- INMS_MS_2016-028_R1026_D005_S331.txt
- INMS_MS_2016-028_R1026_D005_S332.txt
- INMS_MS_2016-028_R1026_D005_S333.txt
- INMS_MS_2016-028_R1026_D005_S334.txt
- INMS_MS_2016-028_R1026_D005_S335.txt
- INMS_MS_2016-028_R1026_D005_S336.txt
- INMS_MS_2016-028_R1026_D005_S337.txt
- INMS_MS_2016-028_R1026_D005_S338.txt
- INMS_MS_2016-028_R1026_D005_S339.txt
- INMS_MS_2016-028_R1026_D005_S340.txt
- INMS_MS_2016-028_R1026_D005_S341.txt
- INMS_MS_2016-028_R1026_D005_S342.txt
- INMS_MS_2016-028_R1026_D005_S343.txt
- INMS_MS_2016-028_R1026_D005_S344.txt
- INMS_MS_2016-028_R1026_D005_S345.txt
- INMS_MS_2016-028_R1026_D005_S346.txt
- INMS_MS_2016-028_R1026_D005_S347.txt
- INMS_MS_2016-028_R1026_D005_S348.txt
- INMS_MS_2016-028_R1026_D005_S349.txt
- INMS_MS_2016-028_R1026_D005_S350.txt
- INMS_MS_2016-028_R1026_D005_S351.txt
- INMS_MS_2016-028_R1026_D005_S352.txt
- INMS_MS_2016-028_R1026_D005_S353.txt
- INMS_MS_2016-028_R1026_D005_S354.txt
- INMS_MS_2016-028_R1026_D005_S355.txt
- INMS_MS_2016-028_R1026_D005_S356.txt
- INMS_MS_2016-028_R1026_D005_S357.txt
- INMS_MS_2016-028_R1026_D005_S358.txt
- INMS_MS_2016-028_R1026_D005_S359.txt
- INMS_MS_2016-028_R1026_D005_S360.txt
- INMS_MS_2016-028_R1026_D005_S361.txt
- INMS_MS_2016-028_R1026_D005_S362.txt
- INMS_MS_2016-028_R1026_D005_S363.txt
- INMS_MS_2016-028_R1026_D005_S364.txt
- INMS_MS_2016-028_R1026_D005_S365.txt
- INMS_MS_2016-028_R1026_D005_S366.txt
- INMS_MS_2016-028_R1026_D005_S367.txt
- INMS_MS_2016-028_R1026_D005_S368.txt
- INMS_MS_2016-028_R1026_D005_S369.txt
- INMS_MS_2016-028_R1026_D005_S370.txt
- INMS_MS_2016-028_R1026_D005_S371.txt
- INMS_MS_2016-028_R1026_D005_S372.txt
- INMS_MS_2016-028_R1026_D005_S373.txt
- INMS_MS_2016-028_R1026_D005_S374.txt
- INMS_MS_2016-028_R1026_D005_S375.txt
- INMS_MS_2016-028_R1026_D005_S376.txt
- INMS_MS_2016-028_R1026_D005_S377.txt
- INMS_MS_2016-028_R1026_D005_S378.txt
- INMS_MS_2016-028_R1026_D005_S379.txt
- INMS_MS_2016-028_R1026_D005_S380.txt
- INMS_MS_2016-028_R1026_D005_S381.txt
- INMS_MS_2016-028_R1026_D005_S382.txt
- INMS_MS_2016-028_R1026_D005_S383.txt
- INMS_MS_2016-028_R1026_D005_S384.txt
- INMS_MS_2016-028_R1026_D005_S385.txt
- INMS_MS_2016-028_R1026_D005_S386.txt
- INMS_MS_2016-028_R1026_D005_S387.txt
- INMS_MS_2016-028_R1026_D005_S388.txt
- INMS_MS_2016-028_R1026_D005_S389.txt
- INMS_MS_2016-028_R1026_D005_S390.txt
- INMS_MS_2016-028_R1026_D005_S391.txt
- INMS_MS_2016-028_R1026_D005_S392.txt
- INMS_MS_2016-028_R1026_D005_S393.txt
- INMS_MS_2016-028_R1026_D005_S394.txt
- INMS_MS_2016-028_R1026_D005_S395.txt
- INMS_MS_2016-028_R1026_D005_S396.txt
- INMS_MS_2016-028_R1026_D005_S397.txt
- INMS_MS_2016-028_R1026_D005_S398.txt
- INMS_MS_2016-028_R1026_D005_S399.txt
- INMS_MS_2016-028_R1026_D005_S400.txt
- INMS_MS_2016-028_R1026_D005_S401.txt
- INMS_MS_2016-028_R1026_D005_S402.txt
- INMS_MS_2016-028_R1026_D005_S403.txt
- INMS_MS_2016-028_R1026_D006_S404.txt
- INMS_MS_2016-028_R1026_D006_S405.txt
- INMS_MS_2016-028_R1026_D006_S406.txt
- INMS_MS_2016-028_R1026_D006_S407.txt
- INMS_MS_2016-028_R1026_D006_S408.txt
- INMS_MS_2016-028_R1026_D006_S409.txt
- INMS_MS_2016-028_R1026_D006_S410.txt
- INMS_MS_2016-028_R1026_D006_S411.txt
- INMS_MS_2016-028_R1026_D006_S412.txt
- INMS_MS_2016-028_R1026_D006_S413.txt
- INMS_MS_2016-028_R1026_D006_S414.txt
- INMS_MS_2016-028_R1026_D006_S415.txt
- INMS_MS_2016-028_R1026_D006_S416.txt
- INMS_MS_2016-028_R1026_D006_S417.txt
- INMS_MS_2016-028_R1026_D006_S418.txt
- INMS_MS_2016-028_R1026_D006_S419.txt
- INMS_MS_2016-028_R1026_D006_S420.txt
- INMS_MS_2016-028_R1026_D006_S421.txt
- INMS_MS_2016-028_R1026_D006_S422.txt
- INMS_MS_2016-028_R1026_D006_S423.txt
- INMS_MS_2016-028_R1026_D006_S424.txt
- INMS_MS_2016-028_R1026_D006_S425.txt
- INMS_MS_2016-028_R1026_D006_S426.txt
- INMS_MS_2016-028_R1026_D006_S427.txt
- INMS_MS_2016-028_R1026_D006_S428.txt
- INMS_MS_2016-028_R1026_D006_S429.txt
- INMS_MS_2016-028_R1026_D006_S430.txt
- INMS_MS_2016-028_R1026_D006_S431.txt
- INMS_MS_2016-028_R1026_D006_S432.txt
- INMS_MS_2016-028_R1026_D006_S433.txt
- INMS_MS_2016-028_R1026_D006_S434.txt
- INMS_MS_2016-028_R1026_D006_S435.txt
- INMS_MS_2016-028_R1026_D006_S436.txt
- INMS_MS_2016-028_R1026_D006_S437.txt
- INMS_MS_2016-028_R1026_D006_S438.txt
- INMS_MS_2016-028_R1026_D006_S439.txt
- INMS_MS_2016-028_R1026_D006_S440.txt
- INMS_MS_2016-028_R1026_D006_S441.txt
- INMS_MS_2016-028_R1026_D006_S442.txt
- INMS_MS_2016-028_R1026_D006_S443.txt
- INMS_MS_2016-028_R1026_D006_S444.txt
- INMS_MS_2016-028_R1026_D006_S445.txt
- INMS_MS_2016-028_R1026_D006_S446.txt
- INMS_MS_2016-028_R1026_D006_S447.txt
- INMS_MS_2016-028_R1026_D006_S448.txt
- INMS_MS_2016-028_R1026_D006_S449.txt
- INMS_MS_2016-028_R1026_D006_S450.txt
- INMS_MS_2016-028_R1026_D006_S451.txt
- INMS_MS_2016-028_R1026_D006_S452.txt
- INMS_MS_2016-028_R1026_D006_S453.txt
- INMS_MS_2016-028_R1026_D006_S454.txt
- INMS_MS_2016-028_R1026_D006_S455.txt
- INMS_MS_2016-028_R1026_D006_S456.txt
- INMS_MS_2016-028_R1026_D006_S457.txt
- INMS_MS_2016-028_R1026_D006_S458.txt
- INMS_MS_2016-028_R1026_D006_S459.txt
- INMS_MS_2016-028_R1026_D006_S460.txt
- INMS_MS_2016-028_R1026_D006_S461.txt
- INMS_MS_2016-028_R1026_D006_S462.txt
- INMS_MS_2016-028_R1026_D006_S463.txt
- INMS_MS_2016-028_R1026_D006_S464.txt
- INMS_MS_2016-028_R1026_D006_S465.txt
- INMS_MS_2016-028_R1026_D006_S466.txt
- INMS_MS_2016-028_R1026_D006_S467.txt
- INMS_MS_2016-028_R1026_D006_S468.txt
- INMS_MS_2016-028_R1026_D006_S469.txt
- INMS_MS_2016-028_R1026_D006_S470.txt
- INMS_MS_2016-028_R1026_D006_S471.txt
- INMS_MS_2016-028_R1026_D006_S472.txt
- INMS_MS_2016-028_R1026_D006_S473.txt
- INMS_MS_2016-028_R1026_D006_S474.txt
- INMS_MS_2016-028_R1026_D006_S475.txt
- INMS_MS_2016-028_R1026_D006_S476.txt
- INMS_MS_2016-028_R1026_D006_S477.txt
- INMS_MS_2016-028_R1026_D006_S478.txt
- INMS_MS_2016-028_R1026_D006_S479.txt
- INMS_MS_2016-028_R1026_D006_S480.txt
- INMS_MS_2016-028_R1026_D006_S481.txt
- INMS_MS_2016-028_R1026_D006_S482.txt
- INMS_MS_2016-028_R1026_D006_S483.txt
- INMS_MS_2016-028_R1026_D007_S484.txt
- INMS_MS_2016-028_R1026_D007_S485.txt
- INMS_MS_2016-028_R1026_D007_S486.txt
- INMS_MS_2016-028_R1026_D007_S487.txt
- INMS_MS_2016-028_R1026_D007_S488.txt
- INMS_MS_2016-028_R1026_D007_S489.txt
- INMS_MS_2016-028_R1026_D007_S490.txt
- INMS_MS_2016-028_R1026_D007_S491.txt
- INMS_MS_2016-028_R1026_D007_S492.txt
- INMS_MS_2016-028_R1026_D007_S493.txt
- INMS_MS_2016-028_R1026_D007_S494.txt
- INMS_MS_2016-028_R1026_D007_S495.txt
- INMS_MS_2016-028_R1026_D007_S496.txt
- INMS_MS_2016-028_R1026_D007_S497.txt
- INMS_MS_2016-028_R1026_D007_S498.txt
- INMS_MS_2016-028_R1026_D007_S499.txt
- INMS_MS_2016-028_R1026_D007_S500.txt
- INMS_MS_2016-028_R1026_D007_S501.txt
- INMS_MS_2016-028_R1026_D007_S502.txt
- INMS_MS_2016-028_R1026_D007_S503.txt
- INMS_MS_2016-028_R1026_D007_S504.txt
- INMS_MS_2016-028_R1026_D007_S505.txt
- INMS_MS_2016-028_R1026_D007_S506.txt
- INMS_MS_2016-028_R1026_D007_S507.txt
- INMS_MS_2016-028_R1026_D007_S508.txt
- INMS_MS_2016-028_R1026_D007_S509.txt
- INMS_MS_2016-028_R1026_D007_S510.txt
- INMS_MS_2016-028_R1026_D007_S511.txt
- INMS_MS_2016-028_R1026_D007_S512.txt
- INMS_MS_2016-028_R1026_D007_S513.txt
- INMS_MS_2016-028_R1026_D007_S514.txt
- INMS_MS_2016-028_R1026_D007_S515.txt
- INMS_MS_2016-028_R1026_D007_S516.txt
- INMS_MS_2016-028_R1026_D007_S517.txt
- INMS_MS_2016-028_R1026_D007_S518.txt
- INMS_MS_2016-028_R1026_D007_S519.txt
- INMS_MS_2016-028_R1026_D007_S520.txt
- INMS_MS_2016-028_R1026_D007_S521.txt
- INMS_MS_2016-028_R1026_D007_S522.txt
- INMS_MS_2016-028_R1026_D007_S523.txt
- INMS_MS_2016-028_R1026_D007_S524.txt
- INMS_MS_2016-028_R1026_D007_S525.txt
- INMS_MS_2016-028_R1026_D007_S526.txt
- INMS_MS_2016-028_R1026_D007_S527.txt
- INMS_MS_2016-028_R1026_D007_S528.txt
- INMS_MS_2016-028_R1026_D007_S529.txt
- INMS_MS_2016-028_R1026_D007_S530.txt
- INMS_MS_2016-028_R1026_D007_S531.txt
- INMS_MS_2016-028_R1026_D007_S532.txt
- INMS_MS_2016-028_R1026_D007_S533.txt
- INMS_MS_2016-028_R1026_D007_S534.txt
- INMS_MS_2016-028_R1026_D007_S535.txt
- INMS_MS_2016-028_R1026_D007_S536.txt
- INMS_MS_2016-028_R1026_D007_S537.txt
- INMS_MS_2016-028_R1026_D007_S538.txt
- INMS_MS_2016-028_R1026_D007_S539.txt
- INMS_MS_2016-028_R1026_D007_S540.txt
- INMS_MS_2016-028_R1026_D007_S541.txt
- INMS_MS_2016-028_R1026_D007_S542.txt
- INMS_MS_2016-028_R1026_D007_S543.txt
- INMS_MS_2016-028_R1026_D007_S544.txt
- INMS_MS_2016-028_R1026_D007_S545.txt
- INMS_MS_2016-028_R1026_D007_S546.txt
- INMS_MS_2016-028_R1026_D007_S547.txt
- INMS_MS_2016-028_R1026_D007_S548.txt
- INMS_MS_2016-028_R1026_D007_S549.txt
- INMS_MS_2016-028_R1026_D007_S550.txt
- INMS_MS_2016-028_R1026_D007_S551.txt
- INMS_MS_2016-028_R1026_D007_S552.txt
- INMS_MS_2016-028_R1026_D007_S553.txt
- INMS_MS_2016-028_R1026_D007_S554.txt
- INMS_MS_2016-028_R1026_D007_S555.txt
- INMS_MS_2016-028_R1026_D007_S556.txt
- INMS_MS_2016-028_R1026_D007_S557.txt
- INMS_MS_2016-028_R1026_D007_S558.txt
- INMS_MS_2016-028_R1026_D007_S559.txt
- INMS_MS_2016-028_R1026_D007_S560.txt
- INMS_MS_2016-028_R1026_D007_S561.txt
- INMS_MS_2016-028_R1026_D007_S562.txt
- INMS_MS_2016-028_R1026_D007_S563.txt
- INMS_MS_2016-028_R1026_D008_S564.txt
- INMS_MS_2016-028_R1026_D008_S565.txt
- INMS_MS_2016-028_R1026_D008_S566.txt
- INMS_MS_2016-028_R1026_D008_S567.txt
- INMS_MS_2016-028_R1026_D008_S568.txt
- INMS_MS_2016-028_R1026_D008_S569.txt
- INMS_MS_2016-028_R1026_D008_S570.txt
- INMS_MS_2016-028_R1026_D008_S571.txt
- INMS_MS_2016-028_R1026_D008_S572.txt
- INMS_MS_2016-028_R1026_D008_S573.txt
- INMS_MS_2016-028_R1026_D008_S574.txt
- INMS_MS_2016-028_R1026_D008_S575.txt
- INMS_MS_2016-028_R1026_D008_S576.txt
- INMS_MS_2016-028_R1026_D008_S577.txt
- INMS_MS_2016-028_R1026_D008_S578.txt
- INMS_MS_2016-028_R1026_D008_S579.txt
- INMS_MS_2016-028_R1026_D008_S580.txt
- INMS_MS_2016-028_R1026_D008_S581.txt
- INMS_MS_2016-028_R1026_D008_S582.txt
- INMS_MS_2016-028_R1026_D008_S583.txt
- INMS_MS_2016-028_R1026_D008_S584.txt
- INMS_MS_2016-028_R1026_D008_S585.txt
- INMS_MS_2016-028_R1026_D008_S586.txt
- INMS_MS_2016-028_R1026_D008_S587.txt
- INMS_MS_2016-028_R1026_D008_S588.txt
- INMS_MS_2016-028_R1026_D008_S589.txt
- INMS_MS_2016-028_R1026_D008_S590.txt
- INMS_MS_2016-028_R1026_D008_S591.txt
- INMS_MS_2016-028_R1026_D008_S592.txt
- INMS_MS_2016-028_R1026_D008_S593.txt
- INMS_MS_2016-028_R1026_D008_S594.txt
- INMS_MS_2016-028_R1026_D008_S595.txt
- INMS_MS_2016-028_R1026_D008_S596.txt
- INMS_MS_2016-028_R1026_D008_S597.txt
- INMS_MS_2016-028_R1026_D008_S598.txt
- INMS_MS_2016-028_R1026_D008_S599.txt
- INMS_MS_2016-028_R1026_D008_S600.txt
- INMS_MS_2016-028_R1026_D008_S601.txt
- INMS_MS_2016-028_R1026_D008_S602.txt
- INMS_MS_2016-028_R1026_D008_S603.txt
- INMS_MS_2016-028_R1026_D008_S604.txt
- INMS_MS_2016-028_R1026_D008_S605.txt
- INMS_MS_2016-028_R1026_D008_S606.txt
- INMS_MS_2016-028_R1026_D008_S607.txt
- INMS_MS_2016-028_R1026_D008_S608.txt
- INMS_MS_2016-028_R1026_D008_S609.txt
- INMS_MS_2016-028_R1026_D008_S610.txt
- INMS_MS_2016-028_R1026_D008_S611.txt
- INMS_MS_2016-028_R1026_D008_S612.txt
- INMS_MS_2016-028_R1026_D008_S613.txt
- INMS_MS_2016-028_R1026_D008_S614.txt
- INMS_MS_2016-028_R1026_D008_S615.txt
- INMS_MS_2016-028_R1026_D008_S616.txt
- INMS_MS_2016-028_R1026_D008_S617.txt
- INMS_MS_2016-028_R1026_D008_S618.txt
- INMS_MS_2016-028_R1026_D008_S619.txt
- INMS_MS_2016-028_R1026_D008_S620.txt
- INMS_MS_2016-028_R1026_D008_S621.txt
- INMS_MS_2016-028_R1026_D008_S622.txt
- INMS_MS_2016-028_R1026_D008_S623.txt
- INMS_MS_2016-028_R1026_D008_S624.txt
- INMS_MS_2016-028_R1026_D008_S625.txt
- INMS_MS_2016-028_R1026_D008_S626.txt
- INMS_MS_2016-028_R1026_D008_S627.txt
- INMS_MS_2016-028_R1026_D008_S628.txt
- INMS_MS_2016-028_R1026_D008_S629.txt
- INMS_MS_2016-028_R1026_D008_S630.txt
- INMS_MS_2016-028_R1026_D008_S631.txt
- INMS_MS_2016-028_R1026_D008_S632.txt
- INMS_MS_2016-028_R1026_D008_S633.txt
- INMS_MS_2016-028_R1026_D008_S634.txt
- INMS_MS_2016-028_R1026_D008_S635.txt
- INMS_MS_2016-028_R1026_D008_S636.txt
- INMS_MS_2016-028_R1026_D008_S637.txt
- INMS_MS_2016-028_R1026_D008_S638.txt
- INMS_MS_2016-028_R1026_D008_S639.txt
- INMS_MS_2016-028_R1026_D008_S640.txt
- INMS_MS_2016-028_R1026_D008_S641.txt
- INMS_MS_2016-028_R1026_D008_S642.txt
- INMS_MS_2016-028_R1026_D008_S643.txt
- INMS_MS_2016-028_R1026_D009_S644.txt
- INMS_MS_2016-028_R1026_D009_S645.txt
- INMS_MS_2016-028_R1026_D009_S646.txt
- INMS_MS_2016-028_R1026_D009_S647.txt
- INMS_MS_2016-028_R1026_D009_S648.txt
- INMS_MS_2016-028_R1026_D009_S649.txt
- INMS_MS_2016-028_R1026_D009_S650.txt
- INMS_MS_2016-028_R1026_D009_S651.txt
- INMS_MS_2016-028_R1026_D009_S652.txt
- INMS_MS_2016-028_R1026_D009_S653.txt
- INMS_MS_2016-028_R1026_D009_S654.txt
- INMS_MS_2016-028_R1026_D009_S655.txt
- INMS_MS_2016-028_R1026_D009_S656.txt
- INMS_MS_2016-028_R1026_D009_S657.txt
- INMS_MS_2016-028_R1026_D009_S658.txt
- INMS_MS_2016-028_R1026_D009_S659.txt
- INMS_MS_2016-028_R1026_D009_S660.txt
- INMS_MS_2016-028_R1026_D009_S661.txt
- INMS_MS_2016-028_R1026_D009_S662.txt
- INMS_MS_2016-028_R1026_D009_S663.txt
- INMS_MS_2016-028_R1026_D009_S664.txt
- INMS_MS_2016-028_R1026_D009_S665.txt
- INMS_MS_2016-028_R1026_D009_S666.txt
- INMS_MS_2016-028_R1026_D009_S667.txt
- INMS_MS_2016-028_R1026_D009_S668.txt
- INMS_MS_2016-028_R1026_D009_S669.txt
- INMS_MS_2016-028_R1026_D009_S670.txt
- INMS_MS_2016-028_R1026_D009_S671.txt
- INMS_MS_2016-028_R1026_D009_S672.txt
- INMS_MS_2016-028_R1026_D009_S673.txt
- INMS_MS_2016-028_R1026_D009_S674.txt
- INMS_MS_2016-028_R1026_D009_S675.txt
- INMS_MS_2016-028_R1026_D009_S676.txt
- INMS_MS_2016-028_R1026_D009_S677.txt
- INMS_MS_2016-028_R1026_D009_S678.txt
- INMS_MS_2016-028_R1026_D009_S679.txt
- INMS_MS_2016-028_R1026_D009_S680.txt
- INMS_MS_2016-028_R1026_D009_S681.txt
- INMS_MS_2016-028_R1026_D009_S682.txt
- INMS_MS_2016-028_R1026_D009_S683.txt
- INMS_MS_2016-028_R1026_D009_S684.txt
- INMS_MS_2016-028_R1026_D009_S685.txt
- INMS_MS_2016-028_R1026_D009_S686.txt
- INMS_MS_2016-028_R1026_D009_S687.txt
- INMS_MS_2016-028_R1026_D009_S688.txt
- INMS_MS_2016-028_R1026_D009_S689.txt
- INMS_MS_2016-028_R1026_D009_S690.txt
- INMS_MS_2016-028_R1026_D009_S691.txt
- INMS_MS_2016-028_R1026_D009_S692.txt
- INMS_MS_2016-028_R1026_D009_S693.txt
- INMS_MS_2016-028_R1026_D009_S694.txt
- INMS_MS_2016-028_R1026_D009_S695.txt
- INMS_MS_2016-028_R1026_D009_S696.txt
- INMS_MS_2016-028_R1026_D009_S697.txt
- INMS_MS_2016-028_R1026_D009_S698.txt
- INMS_MS_2016-028_R1026_D009_S699.txt
- INMS_MS_2016-028_R1026_D009_S700.txt
- INMS_MS_2016-028_R1026_D009_S701.txt
- INMS_MS_2016-028_R1026_D009_S702.txt
- INMS_MS_2016-028_R1026_D009_S703.txt
- INMS_MS_2016-028_R1026_D009_S704.txt
- INMS_MS_2016-028_R1026_D009_S705.txt
- INMS_MS_2016-028_R1026_D009_S706.txt
- INMS_MS_2016-028_R1026_D009_S707.txt
- INMS_MS_2016-028_R1026_D009_S708.txt
- INMS_MS_2016-028_R1026_D009_S709.txt
- INMS_MS_2016-028_R1026_D009_S710.txt
- INMS_MS_2016-028_R1026_D009_S711.txt
- INMS_MS_2016-028_R1026_D009_S712.txt
- INMS_MS_2016-028_R1026_D009_S713.txt
- INMS_MS_2016-028_R1026_D009_S714.txt
- INMS_MS_2016-028_R1026_D009_S715.txt
- INMS_MS_2016-028_R1026_D009_S716.txt
- INMS_MS_2016-028_R1026_D009_S717.txt
- INMS_MS_2016-028_R1026_D009_S718.txt
- INMS_MS_2016-028_R1026_D009_S719.txt
- INMS_MS_2016-028_R1026_D009_S720.txt
- INMS_MS_2016-028_R1026_D009_S721.txt
- INMS_MS_2016-028_R1026_D009_S722.txt
- INMS_MS_2016-028_R1026_D009_S723.txt
- INMS_MS_2016-028_R1026_D010_S724.txt
- INMS_MS_2016-028_R1026_D010_S725.txt
- INMS_MS_2016-028_R1026_D010_S726.txt
- INMS_MS_2016-028_R1026_D010_S727.txt
- INMS_MS_2016-028_R1026_D010_S728.txt
- INMS_MS_2016-028_R1026_D010_S729.txt
- INMS_MS_2016-028_R1026_D010_S730.txt
- INMS_MS_2016-028_R1026_D010_S731.txt
- INMS_MS_2016-028_R1026_D010_S732.txt
- INMS_MS_2016-028_R1026_D010_S733.txt
- INMS_MS_2016-028_R1026_D010_S734.txt
- INMS_MS_2016-028_R1026_D010_S735.txt
- INMS_MS_2016-028_R1026_D010_S736.txt
- INMS_MS_2016-028_R1026_D010_S737.txt
- INMS_MS_2016-028_R1026_D010_S738.txt
- INMS_MS_2016-028_R1026_D010_S739.txt
- INMS_MS_2016-028_R1026_D010_S740.txt
- INMS_MS_2016-028_R1026_D010_S741.txt
- INMS_MS_2016-028_R1026_D010_S742.txt
- INMS_MS_2016-028_R1026_D010_S743.txt
- INMS_MS_2016-028_R1026_D010_S744.txt
- INMS_MS_2016-028_R1026_D010_S745.txt
- INMS_MS_2016-028_R1026_D010_S746.txt
- INMS_MS_2016-028_R1026_D010_S747.txt
- INMS_MS_2016-028_R1026_D010_S748.txt
- INMS_MS_2016-028_R1026_D010_S749.txt
- INMS_MS_2016-028_R1026_D010_S750.txt
- INMS_MS_2016-028_R1026_D010_S751.txt
- INMS_MS_2016-028_R1026_D010_S752.txt
- INMS_MS_2016-028_R1026_D010_S753.txt
- INMS_MS_2016-028_R1026_D010_S754.txt
- INMS_MS_2016-028_R1026_D010_S755.txt
- INMS_MS_2016-028_R1026_D010_S756.txt
- INMS_MS_2016-028_R1026_D010_S757.txt
- INMS_MS_2016-028_R1026_D010_S758.txt
- INMS_MS_2016-028_R1026_D010_S759.txt
- INMS_MS_2016-028_R1026_D010_S760.txt
- INMS_MS_2016-028_R1026_D010_S761.txt
- INMS_MS_2016-028_R1026_D010_S762.txt
- INMS_MS_2016-028_R1026_D010_S763.txt
- INMS_MS_2016-028_R1026_D010_S764.txt
- INMS_MS_2016-028_R1026_D010_S765.txt
- INMS_MS_2016-028_R1026_D010_S766.txt
- INMS_MS_2016-028_R1026_D010_S767.txt
- INMS_MS_2016-028_R1026_D010_S768.txt
- INMS_MS_2016-028_R1026_D010_S769.txt
- INMS_MS_2016-028_R1026_D010_S770.txt
- INMS_MS_2016-028_R1026_D010_S771.txt
- INMS_MS_2016-028_R1026_D010_S772.txt
- INMS_MS_2016-028_R1026_D010_S773.txt
- INMS_MS_2016-028_R1026_D010_S774.txt
- INMS_MS_2016-028_R1026_D010_S775.txt
- INMS_MS_2016-028_R1026_D010_S776.txt
- INMS_MS_2016-028_R1026_D010_S777.txt
- INMS_MS_2016-028_R1026_D010_S778.txt
- INMS_MS_2016-028_R1026_D010_S779.txt
- INMS_MS_2016-028_R1026_D010_S780.txt
- INMS_MS_2016-028_R1026_D010_S781.txt
- INMS_MS_2016-028_R1026_D010_S782.txt
- INMS_MS_2016-028_R1026_D010_S783.txt
- INMS_MS_2016-028_R1026_D010_S784.txt
- INMS_MS_2016-028_R1026_D010_S785.txt
- INMS_MS_2016-028_R1026_D010_S786.txt
- INMS_MS_2016-028_R1026_D010_S787.txt
- INMS_MS_2016-028_R1026_D010_S788.txt
- INMS_MS_2016-028_R1026_D010_S789.txt
- INMS_MS_2016-028_R1026_D010_S790.txt
- INMS_MS_2016-028_R1026_D010_S791.txt
- INMS_MS_2016-028_R1026_D010_S792.txt
- INMS_MS_2016-028_R1026_D010_S793.txt
- INMS_MS_2016-028_R1026_D010_S794.txt
- INMS_MS_2016-028_R1026_D010_S795.txt
- INMS_MS_2016-028_R1026_D010_S796.txt
- INMS_MS_2016-028_R1026_D010_S797.txt
- INMS_MS_2016-028_R1026_D010_S798.txt
- INMS_MS_2016-028_R1026_D010_S799.txt
- INMS_MS_2016-028_R1026_D010_S800.txt
- INMS_MS_2016-028_R1026_D010_S801.txt
- INMS_MS_2016-028_R1026_D010_S802.txt
- INMS_MS_2016-028_R1026_D010_S803.txt
- INMS_JN_2016-046_R1029.txt
- INMS_JN_2016-046_R1030.txt
- INMS_LG_2016-046.txt
- INMS_MN_2016-046_R1029.txt
- INMS_MN_2016-046_R1030.txt
- INMS_MS_2016-046_R1030_D000_S001.txt
- INMS_MS_2016-046_R1030_D000_S002.txt
- INMS_MS_2016-046_R1030_D000_S003.txt
- INMS_MS_2016-046_R1030_D000_S004.txt
- INMS_MS_2016-046_R1030_D000_S005.txt
- INMS_MS_2016-046_R1030_D000_S006.txt
- INMS_MS_2016-046_R1030_D000_S007.txt
- INMS_MS_2016-046_R1030_D000_S008.txt
- INMS_MS_2016-046_R1030_D000_S009.txt
- INMS_MS_2016-046_R1030_D000_S010.txt
- INMS_MS_2016-046_R1030_D000_S171.txt
- INMS_MS_2016-046_R1030_D000_S172.txt
- INMS_MS_2016-046_R1030_D000_S173.txt
- INMS_MS_2016-046_R1030_D000_S174.txt
- INMS_MS_2016-046_R1030_D000_S175.txt
- INMS_MS_2016-046_R1030_D000_S176.txt
- INMS_MS_2016-046_R1030_D001_S011.txt
- INMS_MS_2016-046_R1030_D001_S012.txt
- INMS_MS_2016-046_R1030_D001_S013.txt
- INMS_MS_2016-046_R1030_D001_S014.txt
- INMS_MS_2016-046_R1030_D001_S015.txt
- INMS_MS_2016-046_R1030_D001_S016.txt
- INMS_MS_2016-046_R1030_D001_S017.txt
- INMS_MS_2016-046_R1030_D001_S018.txt
- INMS_MS_2016-046_R1030_D001_S019.txt
- INMS_MS_2016-046_R1030_D001_S020.txt
- INMS_MS_2016-046_R1030_D001_S021.txt
- INMS_MS_2016-046_R1030_D001_S022.txt
- INMS_MS_2016-046_R1030_D001_S023.txt
- INMS_MS_2016-046_R1030_D001_S024.txt
- INMS_MS_2016-046_R1030_D001_S025.txt
- INMS_MS_2016-046_R1030_D001_S026.txt
- INMS_MS_2016-046_R1030_D001_S027.txt
- INMS_MS_2016-046_R1030_D001_S028.txt
- INMS_MS_2016-046_R1030_D001_S029.txt
- INMS_MS_2016-046_R1030_D001_S030.txt
- INMS_MS_2016-046_R1030_D001_S031.txt
- INMS_MS_2016-046_R1030_D001_S032.txt
- INMS_MS_2016-046_R1030_D001_S033.txt
- INMS_MS_2016-046_R1030_D001_S034.txt
- INMS_MS_2016-046_R1030_D001_S035.txt
- INMS_MS_2016-046_R1030_D001_S036.txt
- INMS_MS_2016-046_R1030_D001_S037.txt
- INMS_MS_2016-046_R1030_D001_S038.txt
- INMS_MS_2016-046_R1030_D001_S039.txt
- INMS_MS_2016-046_R1030_D001_S040.txt
- INMS_MS_2016-046_R1030_D001_S041.txt
- INMS_MS_2016-046_R1030_D001_S042.txt
- INMS_MS_2016-046_R1030_D001_S043.txt
- INMS_MS_2016-046_R1030_D001_S044.txt
- INMS_MS_2016-046_R1030_D001_S045.txt
- INMS_MS_2016-046_R1030_D001_S046.txt
- INMS_MS_2016-046_R1030_D001_S047.txt
- INMS_MS_2016-046_R1030_D001_S048.txt
- INMS_MS_2016-046_R1030_D001_S049.txt
- INMS_MS_2016-046_R1030_D001_S050.txt
- INMS_MS_2016-046_R1030_D001_S051.txt
- INMS_MS_2016-046_R1030_D001_S052.txt
- INMS_MS_2016-046_R1030_D001_S053.txt
- INMS_MS_2016-046_R1030_D001_S054.txt
- INMS_MS_2016-046_R1030_D001_S055.txt
- INMS_MS_2016-046_R1030_D001_S056.txt
- INMS_MS_2016-046_R1030_D001_S057.txt
- INMS_MS_2016-046_R1030_D001_S058.txt
- INMS_MS_2016-046_R1030_D001_S059.txt
- INMS_MS_2016-046_R1030_D001_S060.txt
- INMS_MS_2016-046_R1030_D001_S061.txt
- INMS_MS_2016-046_R1030_D001_S062.txt
- INMS_MS_2016-046_R1030_D001_S063.txt
- INMS_MS_2016-046_R1030_D001_S064.txt
- INMS_MS_2016-046_R1030_D001_S065.txt
- INMS_MS_2016-046_R1030_D001_S066.txt
- INMS_MS_2016-046_R1030_D001_S067.txt
- INMS_MS_2016-046_R1030_D001_S068.txt
- INMS_MS_2016-046_R1030_D001_S069.txt
- INMS_MS_2016-046_R1030_D001_S070.txt
- INMS_MS_2016-046_R1030_D001_S071.txt
- INMS_MS_2016-046_R1030_D001_S072.txt
- INMS_MS_2016-046_R1030_D001_S073.txt
- INMS_MS_2016-046_R1030_D001_S074.txt
- INMS_MS_2016-046_R1030_D001_S075.txt
- INMS_MS_2016-046_R1030_D001_S076.txt
- INMS_MS_2016-046_R1030_D001_S077.txt
- INMS_MS_2016-046_R1030_D001_S078.txt
- INMS_MS_2016-046_R1030_D001_S079.txt
- INMS_MS_2016-046_R1030_D001_S080.txt
- INMS_MS_2016-046_R1030_D001_S081.txt
- INMS_MS_2016-046_R1030_D001_S082.txt
- INMS_MS_2016-046_R1030_D001_S083.txt
- INMS_MS_2016-046_R1030_D001_S084.txt
- INMS_MS_2016-046_R1030_D001_S085.txt
- INMS_MS_2016-046_R1030_D001_S086.txt
- INMS_MS_2016-046_R1030_D001_S087.txt
- INMS_MS_2016-046_R1030_D001_S088.txt
- INMS_MS_2016-046_R1030_D001_S089.txt
- INMS_MS_2016-046_R1030_D001_S090.txt
- INMS_MS_2016-046_R1030_D002_S091.txt
- INMS_MS_2016-046_R1030_D002_S092.txt
- INMS_MS_2016-046_R1030_D002_S093.txt
- INMS_MS_2016-046_R1030_D002_S094.txt
- INMS_MS_2016-046_R1030_D002_S095.txt
- INMS_MS_2016-046_R1030_D002_S096.txt
- INMS_MS_2016-046_R1030_D002_S097.txt
- INMS_MS_2016-046_R1030_D002_S098.txt
- INMS_MS_2016-046_R1030_D002_S099.txt
- INMS_MS_2016-046_R1030_D002_S100.txt
- INMS_MS_2016-046_R1030_D002_S101.txt
- INMS_MS_2016-046_R1030_D002_S102.txt
- INMS_MS_2016-046_R1030_D002_S103.txt
- INMS_MS_2016-046_R1030_D002_S104.txt
- INMS_MS_2016-046_R1030_D002_S105.txt
- INMS_MS_2016-046_R1030_D002_S106.txt
- INMS_MS_2016-046_R1030_D002_S107.txt
- INMS_MS_2016-046_R1030_D002_S108.txt
- INMS_MS_2016-046_R1030_D002_S109.txt
- INMS_MS_2016-046_R1030_D002_S110.txt
- INMS_MS_2016-046_R1030_D002_S111.txt
- INMS_MS_2016-046_R1030_D002_S112.txt
- INMS_MS_2016-046_R1030_D002_S113.txt
- INMS_MS_2016-046_R1030_D002_S114.txt
- INMS_MS_2016-046_R1030_D002_S115.txt
- INMS_MS_2016-046_R1030_D002_S116.txt
- INMS_MS_2016-046_R1030_D002_S117.txt
- INMS_MS_2016-046_R1030_D002_S118.txt
- INMS_MS_2016-046_R1030_D002_S119.txt
- INMS_MS_2016-046_R1030_D002_S120.txt
- INMS_MS_2016-046_R1030_D002_S121.txt
- INMS_MS_2016-046_R1030_D002_S122.txt
- INMS_MS_2016-046_R1030_D002_S123.txt
- INMS_MS_2016-046_R1030_D002_S124.txt
- INMS_MS_2016-046_R1030_D002_S125.txt
- INMS_MS_2016-046_R1030_D002_S126.txt
- INMS_MS_2016-046_R1030_D002_S127.txt
- INMS_MS_2016-046_R1030_D002_S128.txt
- INMS_MS_2016-046_R1030_D002_S129.txt
- INMS_MS_2016-046_R1030_D002_S130.txt
- INMS_MS_2016-046_R1030_D002_S131.txt
- INMS_MS_2016-046_R1030_D002_S132.txt
- INMS_MS_2016-046_R1030_D002_S133.txt
- INMS_MS_2016-046_R1030_D002_S134.txt
- INMS_MS_2016-046_R1030_D002_S135.txt
- INMS_MS_2016-046_R1030_D002_S136.txt
- INMS_MS_2016-046_R1030_D002_S137.txt
- INMS_MS_2016-046_R1030_D002_S138.txt
- INMS_MS_2016-046_R1030_D002_S139.txt
- INMS_MS_2016-046_R1030_D002_S140.txt
- INMS_MS_2016-046_R1030_D002_S141.txt
- INMS_MS_2016-046_R1030_D002_S142.txt
- INMS_MS_2016-046_R1030_D002_S143.txt
- INMS_MS_2016-046_R1030_D002_S144.txt
- INMS_MS_2016-046_R1030_D002_S145.txt
- INMS_MS_2016-046_R1030_D002_S146.txt
- INMS_MS_2016-046_R1030_D002_S147.txt
- INMS_MS_2016-046_R1030_D002_S148.txt
- INMS_MS_2016-046_R1030_D002_S149.txt
- INMS_MS_2016-046_R1030_D002_S150.txt
- INMS_MS_2016-046_R1030_D002_S151.txt
- INMS_MS_2016-046_R1030_D002_S152.txt
- INMS_MS_2016-046_R1030_D002_S153.txt
- INMS_MS_2016-046_R1030_D002_S154.txt
- INMS_MS_2016-046_R1030_D002_S155.txt
- INMS_MS_2016-046_R1030_D002_S156.txt
- INMS_MS_2016-046_R1030_D002_S157.txt
- INMS_MS_2016-046_R1030_D002_S158.txt
- INMS_MS_2016-046_R1030_D002_S159.txt
- INMS_MS_2016-046_R1030_D002_S160.txt
- INMS_MS_2016-046_R1030_D002_S161.txt
- INMS_MS_2016-046_R1030_D002_S162.txt
- INMS_MS_2016-046_R1030_D002_S163.txt
- INMS_MS_2016-046_R1030_D002_S164.txt
- INMS_MS_2016-046_R1030_D002_S165.txt
- INMS_MS_2016-046_R1030_D002_S166.txt
- INMS_MS_2016-046_R1030_D002_S167.txt
- INMS_MS_2016-046_R1030_D002_S168.txt
- INMS_MS_2016-046_R1030_D002_S169.txt
- INMS_MS_2016-046_R1030_D002_S170.txt
- INMS_MS_2016-046_R1030_D003_S177.txt
- INMS_MS_2016-046_R1030_D003_S178.txt
- INMS_MS_2016-046_R1030_D003_S179.txt
- INMS_MS_2016-046_R1030_D003_S180.txt
- INMS_MS_2016-046_R1030_D003_S181.txt
- INMS_MS_2016-046_R1030_D003_S182.txt
- INMS_MS_2016-046_R1030_D003_S183.txt
- INMS_MS_2016-046_R1030_D003_S184.txt
- INMS_MS_2016-046_R1030_D003_S185.txt
- INMS_MS_2016-046_R1030_D003_S186.txt
- INMS_MS_2016-046_R1030_D003_S187.txt
- INMS_MS_2016-046_R1030_D003_S188.txt
- INMS_MS_2016-046_R1030_D003_S189.txt
- INMS_MS_2016-046_R1030_D003_S190.txt
- INMS_MS_2016-046_R1030_D003_S191.txt
- INMS_MS_2016-046_R1030_D003_S192.txt
- INMS_MS_2016-046_R1030_D003_S193.txt
- INMS_MS_2016-046_R1030_D003_S194.txt
- INMS_MS_2016-046_R1030_D003_S195.txt
- INMS_MS_2016-046_R1030_D003_S196.txt
- INMS_MS_2016-046_R1030_D003_S197.txt
- INMS_MS_2016-046_R1030_D003_S198.txt
- INMS_MS_2016-046_R1030_D003_S199.txt
- INMS_MS_2016-046_R1030_D003_S200.txt
- INMS_MS_2016-046_R1030_D003_S201.txt
- INMS_MS_2016-046_R1030_D003_S202.txt
- INMS_MS_2016-046_R1030_D003_S203.txt
- INMS_MS_2016-046_R1030_D003_S204.txt
- INMS_MS_2016-046_R1030_D003_S205.txt
- INMS_MS_2016-046_R1030_D003_S206.txt
- INMS_MS_2016-046_R1030_D003_S207.txt
- INMS_MS_2016-046_R1030_D003_S208.txt
- INMS_MS_2016-046_R1030_D003_S209.txt
- INMS_MS_2016-046_R1030_D003_S210.txt
- INMS_MS_2016-046_R1030_D003_S211.txt
- INMS_MS_2016-046_R1030_D003_S212.txt
- INMS_MS_2016-046_R1030_D003_S213.txt
- INMS_MS_2016-046_R1030_D003_S214.txt
- INMS_MS_2016-046_R1030_D003_S215.txt
- INMS_MS_2016-046_R1030_D003_S216.txt
- INMS_MS_2016-046_R1030_D003_S217.txt
- INMS_MS_2016-046_R1030_D003_S218.txt
- INMS_MS_2016-046_R1030_D003_S219.txt
- INMS_MS_2016-046_R1030_D003_S220.txt
- INMS_MS_2016-046_R1030_D003_S221.txt
- INMS_MS_2016-046_R1030_D003_S222.txt
- INMS_MS_2016-046_R1030_D003_S223.txt
- INMS_MS_2016-046_R1030_D003_S224.txt
- INMS_MS_2016-046_R1030_D003_S225.txt
- INMS_MS_2016-046_R1030_D003_S226.txt
- INMS_MS_2016-046_R1030_D003_S227.txt
- INMS_MS_2016-046_R1030_D003_S228.txt
- INMS_MS_2016-046_R1030_D003_S229.txt
- INMS_MS_2016-046_R1030_D003_S230.txt
- INMS_MS_2016-046_R1030_D003_S231.txt
- INMS_MS_2016-046_R1030_D003_S232.txt
- INMS_MS_2016-046_R1030_D003_S233.txt
- INMS_MS_2016-046_R1030_D003_S234.txt
- INMS_MS_2016-046_R1030_D003_S235.txt
- INMS_MS_2016-046_R1030_D003_S236.txt
- INMS_MS_2016-046_R1030_D003_S237.txt
- INMS_MS_2016-046_R1030_D003_S238.txt
- INMS_MS_2016-046_R1030_D003_S239.txt
- INMS_MS_2016-046_R1030_D003_S240.txt
- INMS_MS_2016-046_R1030_D003_S241.txt
- INMS_MS_2016-046_R1030_D003_S242.txt
- INMS_MS_2016-046_R1030_D003_S243.txt
- INMS_MS_2016-046_R1030_D003_S244.txt
- INMS_MS_2016-046_R1030_D003_S245.txt
- INMS_MS_2016-046_R1030_D003_S246.txt
- INMS_MS_2016-046_R1030_D003_S247.txt
- INMS_MS_2016-046_R1030_D003_S248.txt
- INMS_MS_2016-046_R1030_D003_S249.txt
- INMS_MS_2016-046_R1030_D003_S250.txt
- INMS_MS_2016-046_R1030_D003_S251.txt
- INMS_MS_2016-046_R1030_D003_S252.txt
- INMS_MS_2016-046_R1030_D003_S253.txt
- INMS_MS_2016-046_R1030_D003_S254.txt
- INMS_MS_2016-046_R1030_D003_S255.txt
- INMS_MS_2016-046_R1030_D003_S256.txt
- INMS_MS_2016-046_R1030_D004_S257.txt
- INMS_MS_2016-046_R1030_D004_S258.txt
- INMS_MS_2016-046_R1030_D004_S259.txt
- INMS_MS_2016-046_R1030_D004_S260.txt
- INMS_MS_2016-046_R1030_D004_S261.txt
- INMS_MS_2016-046_R1030_D004_S262.txt
- INMS_MS_2016-046_R1030_D004_S263.txt
- INMS_MS_2016-046_R1030_D004_S264.txt
- INMS_MS_2016-046_R1030_D004_S265.txt
- INMS_MS_2016-046_R1030_D004_S266.txt
- INMS_MS_2016-046_R1030_D004_S267.txt
- INMS_MS_2016-046_R1030_D004_S268.txt
- INMS_MS_2016-046_R1030_D004_S269.txt
- INMS_MS_2016-046_R1030_D004_S270.txt
- INMS_MS_2016-046_R1030_D004_S271.txt
- INMS_MS_2016-046_R1030_D004_S272.txt
- INMS_MS_2016-046_R1030_D004_S273.txt
- INMS_MS_2016-046_R1030_D004_S274.txt
- INMS_MS_2016-046_R1030_D004_S275.txt
- INMS_MS_2016-046_R1030_D004_S276.txt
- INMS_MS_2016-046_R1030_D004_S277.txt
- INMS_MS_2016-046_R1030_D004_S278.txt
- INMS_MS_2016-046_R1030_D004_S279.txt
- INMS_MS_2016-046_R1030_D004_S280.txt
- INMS_MS_2016-046_R1030_D004_S281.txt
- INMS_MS_2016-046_R1030_D004_S282.txt
- INMS_MS_2016-046_R1030_D004_S283.txt
- INMS_MS_2016-046_R1030_D004_S284.txt
- INMS_MS_2016-046_R1030_D004_S285.txt
- INMS_MS_2016-046_R1030_D004_S286.txt
- INMS_MS_2016-046_R1030_D004_S287.txt
- INMS_MS_2016-046_R1030_D004_S288.txt
- INMS_MS_2016-046_R1030_D004_S289.txt
- INMS_MS_2016-046_R1030_D004_S290.txt
- INMS_MS_2016-046_R1030_D004_S291.txt
- INMS_MS_2016-046_R1030_D004_S292.txt
- INMS_MS_2016-046_R1030_D004_S293.txt
- INMS_MS_2016-046_R1030_D004_S294.txt
- INMS_MS_2016-046_R1030_D004_S295.txt
- INMS_MS_2016-046_R1030_D004_S296.txt
- INMS_MS_2016-046_R1030_D004_S297.txt
- INMS_MS_2016-046_R1030_D004_S298.txt
- INMS_MS_2016-046_R1030_D004_S299.txt
- INMS_MS_2016-046_R1030_D004_S300.txt
- INMS_MS_2016-046_R1030_D004_S301.txt
- INMS_MS_2016-046_R1030_D004_S302.txt
- INMS_MS_2016-046_R1030_D004_S303.txt
- INMS_MS_2016-046_R1030_D004_S304.txt
- INMS_MS_2016-046_R1030_D004_S305.txt
- INMS_MS_2016-046_R1030_D004_S306.txt
- INMS_MS_2016-046_R1030_D004_S307.txt
- INMS_MS_2016-046_R1030_D004_S308.txt
- INMS_MS_2016-046_R1030_D004_S309.txt
- INMS_MS_2016-046_R1030_D004_S310.txt
- INMS_MS_2016-046_R1030_D004_S311.txt
- INMS_MS_2016-046_R1030_D004_S312.txt
- INMS_MS_2016-046_R1030_D004_S313.txt
- INMS_MS_2016-046_R1030_D004_S314.txt
- INMS_MS_2016-046_R1030_D004_S315.txt
- INMS_MS_2016-046_R1030_D004_S316.txt
- INMS_MS_2016-046_R1030_D004_S317.txt
- INMS_MS_2016-046_R1030_D004_S318.txt
- INMS_MS_2016-046_R1030_D004_S319.txt
- INMS_MS_2016-046_R1030_D004_S320.txt
- INMS_MS_2016-046_R1030_D004_S321.txt
- INMS_MS_2016-046_R1030_D004_S322.txt
- INMS_MS_2016-046_R1030_D004_S323.txt
- INMS_MS_2016-046_R1030_D004_S324.txt
- INMS_MS_2016-046_R1030_D004_S325.txt
- INMS_MS_2016-046_R1030_D004_S326.txt
- INMS_MS_2016-046_R1030_D004_S327.txt
- INMS_MS_2016-046_R1030_D004_S328.txt
- INMS_MS_2016-046_R1030_D004_S329.txt
- INMS_MS_2016-046_R1030_D004_S330.txt
- INMS_MS_2016-046_R1030_D004_S331.txt
- INMS_MS_2016-046_R1030_D004_S332.txt
- INMS_MS_2016-046_R1030_D004_S333.txt
- INMS_MS_2016-046_R1030_D004_S334.txt
- INMS_MS_2016-046_R1030_D004_S335.txt
- INMS_MS_2016-046_R1030_D004_S336.txt
- INMS_MS_2016-046_R1030_D005_S337.txt
- INMS_MS_2016-046_R1030_D005_S338.txt
- INMS_MS_2016-046_R1030_D005_S339.txt
- INMS_MS_2016-046_R1030_D005_S340.txt
- INMS_MS_2016-046_R1030_D005_S341.txt
- INMS_MS_2016-046_R1030_D005_S342.txt
- INMS_MS_2016-046_R1030_D005_S343.txt
- INMS_MS_2016-046_R1030_D005_S344.txt
- INMS_MS_2016-046_R1030_D005_S345.txt
- INMS_MS_2016-046_R1030_D005_S346.txt
- INMS_MS_2016-046_R1030_D005_S347.txt
- INMS_MS_2016-046_R1030_D005_S348.txt
- INMS_MS_2016-046_R1030_D005_S349.txt
- INMS_MS_2016-046_R1030_D005_S350.txt
- INMS_MS_2016-046_R1030_D005_S351.txt
- INMS_MS_2016-046_R1030_D005_S352.txt
- INMS_MS_2016-046_R1030_D005_S353.txt
- INMS_MS_2016-046_R1030_D005_S354.txt
- INMS_MS_2016-046_R1030_D005_S355.txt
- INMS_MS_2016-046_R1030_D005_S356.txt
- INMS_MS_2016-046_R1030_D005_S357.txt
- INMS_MS_2016-046_R1030_D005_S358.txt
- INMS_MS_2016-046_R1030_D005_S359.txt
- INMS_MS_2016-046_R1030_D005_S360.txt
- INMS_MS_2016-046_R1030_D005_S361.txt
- INMS_MS_2016-046_R1030_D005_S362.txt
- INMS_MS_2016-046_R1030_D005_S363.txt
- INMS_MS_2016-046_R1030_D005_S364.txt
- INMS_MS_2016-046_R1030_D005_S365.txt
- INMS_MS_2016-046_R1030_D005_S366.txt
- INMS_MS_2016-046_R1030_D005_S367.txt
- INMS_MS_2016-046_R1030_D005_S368.txt
- INMS_MS_2016-046_R1030_D005_S369.txt
- INMS_MS_2016-046_R1030_D005_S370.txt
- INMS_MS_2016-046_R1030_D005_S371.txt
- INMS_MS_2016-046_R1030_D005_S372.txt
- INMS_MS_2016-046_R1030_D005_S373.txt
- INMS_MS_2016-046_R1030_D005_S374.txt
- INMS_MS_2016-046_R1030_D005_S375.txt
- INMS_MS_2016-046_R1030_D005_S376.txt
- INMS_MS_2016-046_R1030_D005_S377.txt
- INMS_MS_2016-046_R1030_D005_S378.txt
- INMS_MS_2016-046_R1030_D005_S379.txt
- INMS_MS_2016-046_R1030_D005_S380.txt
- INMS_MS_2016-046_R1030_D005_S381.txt
- INMS_MS_2016-046_R1030_D005_S382.txt
- INMS_MS_2016-046_R1030_D005_S383.txt
- INMS_MS_2016-046_R1030_D005_S384.txt
- INMS_MS_2016-046_R1030_D005_S385.txt
- INMS_MS_2016-046_R1030_D005_S386.txt
- INMS_MS_2016-046_R1030_D005_S387.txt
- INMS_MS_2016-046_R1030_D005_S388.txt
- INMS_MS_2016-046_R1030_D005_S389.txt
- INMS_MS_2016-046_R1030_D005_S390.txt
- INMS_MS_2016-046_R1030_D005_S391.txt
- INMS_MS_2016-046_R1030_D005_S392.txt
- INMS_MS_2016-046_R1030_D005_S393.txt
- INMS_MS_2016-046_R1030_D005_S394.txt
- INMS_MS_2016-046_R1030_D005_S395.txt
- INMS_MS_2016-046_R1030_D005_S396.txt
- INMS_MS_2016-046_R1030_D005_S397.txt
- INMS_MS_2016-046_R1030_D005_S398.txt
- INMS_MS_2016-046_R1030_D005_S399.txt
- INMS_MS_2016-046_R1030_D005_S400.txt
- INMS_MS_2016-046_R1030_D005_S401.txt
- INMS_MS_2016-046_R1030_D005_S402.txt
- INMS_MS_2016-046_R1030_D005_S403.txt
- INMS_MS_2016-046_R1030_D005_S404.txt
- INMS_MS_2016-046_R1030_D005_S405.txt
- INMS_MS_2016-046_R1030_D005_S406.txt
- INMS_MS_2016-046_R1030_D005_S407.txt
- INMS_MS_2016-046_R1030_D005_S408.txt
- INMS_MS_2016-046_R1030_D005_S409.txt
- INMS_MS_2016-046_R1030_D005_S410.txt
- INMS_MS_2016-046_R1030_D005_S411.txt
- INMS_MS_2016-046_R1030_D005_S412.txt
- INMS_MS_2016-046_R1030_D005_S413.txt
- INMS_MS_2016-046_R1030_D005_S414.txt
- INMS_MS_2016-046_R1030_D005_S415.txt
- INMS_MS_2016-046_R1030_D005_S416.txt
- INMS_MS_2016-046_R1030_D006_S417.txt
- INMS_MS_2016-046_R1030_D006_S418.txt
- INMS_MS_2016-046_R1030_D006_S419.txt
- INMS_MS_2016-046_R1030_D006_S420.txt
- INMS_MS_2016-046_R1030_D006_S421.txt
- INMS_MS_2016-046_R1030_D006_S422.txt
- INMS_MS_2016-046_R1030_D006_S423.txt
- INMS_MS_2016-046_R1030_D006_S424.txt
- INMS_MS_2016-046_R1030_D006_S425.txt
- INMS_MS_2016-046_R1030_D006_S426.txt
- INMS_MS_2016-046_R1030_D006_S427.txt
- INMS_MS_2016-046_R1030_D006_S428.txt
- INMS_MS_2016-046_R1030_D006_S429.txt
- INMS_MS_2016-046_R1030_D006_S430.txt
- INMS_MS_2016-046_R1030_D006_S431.txt
- INMS_MS_2016-046_R1030_D006_S432.txt
- INMS_MS_2016-046_R1030_D006_S433.txt
- INMS_MS_2016-046_R1030_D006_S434.txt
- INMS_MS_2016-046_R1030_D006_S435.txt
- INMS_MS_2016-046_R1030_D006_S436.txt
- INMS_MS_2016-046_R1030_D006_S437.txt
- INMS_MS_2016-046_R1030_D006_S438.txt
- INMS_MS_2016-046_R1030_D006_S439.txt
- INMS_MS_2016-046_R1030_D006_S440.txt
- INMS_MS_2016-046_R1030_D006_S441.txt
- INMS_MS_2016-046_R1030_D006_S442.txt
- INMS_MS_2016-046_R1030_D006_S443.txt
- INMS_MS_2016-046_R1030_D006_S444.txt
- INMS_MS_2016-046_R1030_D006_S445.txt
- INMS_MS_2016-046_R1030_D006_S446.txt
- INMS_MS_2016-046_R1030_D006_S447.txt
- INMS_MS_2016-046_R1030_D006_S448.txt
- INMS_MS_2016-046_R1030_D006_S449.txt
- INMS_MS_2016-046_R1030_D006_S450.txt
- INMS_MS_2016-046_R1030_D006_S451.txt
- INMS_MS_2016-046_R1030_D006_S452.txt
- INMS_MS_2016-046_R1030_D006_S453.txt
- INMS_MS_2016-046_R1030_D006_S454.txt
- INMS_MS_2016-046_R1030_D006_S455.txt
- INMS_MS_2016-046_R1030_D006_S456.txt
- INMS_MS_2016-046_R1030_D006_S457.txt
- INMS_MS_2016-046_R1030_D006_S458.txt
- INMS_MS_2016-046_R1030_D006_S459.txt
- INMS_MS_2016-046_R1030_D006_S460.txt
- INMS_MS_2016-046_R1030_D006_S461.txt
- INMS_MS_2016-046_R1030_D006_S462.txt
- INMS_MS_2016-046_R1030_D006_S463.txt
- INMS_MS_2016-046_R1030_D006_S464.txt
- INMS_MS_2016-046_R1030_D006_S465.txt
- INMS_MS_2016-046_R1030_D006_S466.txt
- INMS_MS_2016-046_R1030_D006_S467.txt
- INMS_MS_2016-046_R1030_D006_S468.txt
- INMS_MS_2016-046_R1030_D006_S469.txt
- INMS_MS_2016-046_R1030_D006_S470.txt
- INMS_MS_2016-046_R1030_D006_S471.txt
- INMS_MS_2016-046_R1030_D006_S472.txt
- INMS_MS_2016-046_R1030_D006_S473.txt
- INMS_MS_2016-046_R1030_D006_S474.txt
- INMS_MS_2016-046_R1030_D006_S475.txt
- INMS_MS_2016-046_R1030_D006_S476.txt
- INMS_MS_2016-046_R1030_D006_S477.txt
- INMS_MS_2016-046_R1030_D006_S478.txt
- INMS_MS_2016-046_R1030_D006_S479.txt
- INMS_MS_2016-046_R1030_D006_S480.txt
- INMS_MS_2016-046_R1030_D006_S481.txt
- INMS_MS_2016-046_R1030_D006_S482.txt
- INMS_MS_2016-046_R1030_D006_S483.txt
- INMS_MS_2016-046_R1030_D006_S484.txt
- INMS_MS_2016-046_R1030_D006_S485.txt
- INMS_MS_2016-046_R1030_D006_S486.txt
- INMS_MS_2016-046_R1030_D006_S487.txt
- INMS_MS_2016-046_R1030_D006_S488.txt
- INMS_MS_2016-046_R1030_D006_S489.txt
- INMS_MS_2016-046_R1030_D006_S490.txt
- INMS_MS_2016-046_R1030_D006_S491.txt
- INMS_MS_2016-046_R1030_D006_S492.txt
- INMS_MS_2016-046_R1030_D006_S493.txt
- INMS_MS_2016-046_R1030_D006_S494.txt
- INMS_MS_2016-046_R1030_D006_S495.txt
- INMS_MS_2016-046_R1030_D006_S496.txt
- INMS_MS_2016-046_R1030_D007_S497.txt
- INMS_MS_2016-046_R1030_D007_S498.txt
- INMS_MS_2016-046_R1030_D007_S499.txt
- INMS_MS_2016-046_R1030_D007_S500.txt
- INMS_MS_2016-046_R1030_D007_S501.txt
- INMS_MS_2016-046_R1030_D007_S502.txt
- INMS_MS_2016-046_R1030_D007_S503.txt
- INMS_MS_2016-046_R1030_D007_S504.txt
- INMS_MS_2016-046_R1030_D007_S505.txt
- INMS_MS_2016-046_R1030_D007_S506.txt
- INMS_MS_2016-046_R1030_D007_S507.txt
- INMS_MS_2016-046_R1030_D007_S508.txt
- INMS_MS_2016-046_R1030_D007_S509.txt
- INMS_MS_2016-046_R1030_D007_S510.txt
- INMS_MS_2016-046_R1030_D007_S511.txt
- INMS_MS_2016-046_R1030_D007_S512.txt
- INMS_MS_2016-046_R1030_D007_S513.txt
- INMS_MS_2016-046_R1030_D007_S514.txt
- INMS_MS_2016-046_R1030_D007_S515.txt
- INMS_MS_2016-046_R1030_D007_S516.txt
- INMS_MS_2016-046_R1030_D007_S517.txt
- INMS_MS_2016-046_R1030_D007_S518.txt
- INMS_MS_2016-046_R1030_D007_S519.txt
- INMS_MS_2016-046_R1030_D007_S520.txt
- INMS_MS_2016-046_R1030_D007_S521.txt
- INMS_MS_2016-046_R1030_D007_S522.txt
- INMS_MS_2016-046_R1030_D007_S523.txt
- INMS_MS_2016-046_R1030_D007_S524.txt
- INMS_MS_2016-046_R1030_D007_S525.txt
- INMS_MS_2016-046_R1030_D007_S526.txt
- INMS_MS_2016-046_R1030_D007_S527.txt
- INMS_MS_2016-046_R1030_D007_S528.txt
- INMS_MS_2016-046_R1030_D007_S529.txt
- INMS_MS_2016-046_R1030_D007_S530.txt
- INMS_MS_2016-046_R1030_D007_S531.txt
- INMS_MS_2016-046_R1030_D007_S532.txt
- INMS_MS_2016-046_R1030_D007_S533.txt
- INMS_MS_2016-046_R1030_D007_S534.txt
- INMS_MS_2016-046_R1030_D007_S535.txt
- INMS_MS_2016-046_R1030_D007_S536.txt
- INMS_MS_2016-046_R1030_D007_S537.txt
- INMS_MS_2016-046_R1030_D007_S538.txt
- INMS_MS_2016-046_R1030_D007_S539.txt
- INMS_MS_2016-046_R1030_D007_S540.txt
- INMS_MS_2016-046_R1030_D007_S541.txt
- INMS_MS_2016-046_R1030_D007_S542.txt
- INMS_MS_2016-046_R1030_D007_S543.txt
- INMS_MS_2016-046_R1030_D007_S544.txt
- INMS_MS_2016-046_R1030_D007_S545.txt
- INMS_MS_2016-046_R1030_D007_S546.txt
- INMS_MS_2016-046_R1030_D007_S547.txt
- INMS_MS_2016-046_R1030_D007_S548.txt
- INMS_MS_2016-046_R1030_D007_S549.txt
- INMS_MS_2016-046_R1030_D007_S550.txt
- INMS_MS_2016-046_R1030_D007_S551.txt
- INMS_MS_2016-046_R1030_D007_S552.txt
- INMS_MS_2016-046_R1030_D007_S553.txt
- INMS_MS_2016-046_R1030_D007_S554.txt
- INMS_MS_2016-046_R1030_D007_S555.txt
- INMS_MS_2016-046_R1030_D007_S556.txt
- INMS_MS_2016-046_R1030_D007_S557.txt
- INMS_MS_2016-046_R1030_D007_S558.txt
- INMS_MS_2016-046_R1030_D007_S559.txt
- INMS_MS_2016-046_R1030_D007_S560.txt
- INMS_MS_2016-046_R1030_D007_S561.txt
- INMS_MS_2016-046_R1030_D007_S562.txt
- INMS_MS_2016-046_R1030_D007_S563.txt
- INMS_MS_2016-046_R1030_D007_S564.txt
- INMS_MS_2016-046_R1030_D007_S565.txt
- INMS_MS_2016-046_R1030_D007_S566.txt
- INMS_MS_2016-046_R1030_D007_S567.txt
- INMS_MS_2016-046_R1030_D007_S568.txt
- INMS_MS_2016-046_R1030_D007_S569.txt
- INMS_MS_2016-046_R1030_D007_S570.txt
- INMS_MS_2016-046_R1030_D007_S571.txt
- INMS_MS_2016-046_R1030_D007_S572.txt
- INMS_MS_2016-046_R1030_D007_S573.txt
- INMS_MS_2016-046_R1030_D007_S574.txt
- INMS_MS_2016-046_R1030_D007_S575.txt
- INMS_MS_2016-046_R1030_D007_S576.txt
- INMS_MS_2016-046_R1030_D008_S577.txt
- INMS_MS_2016-046_R1030_D008_S578.txt
- INMS_MS_2016-046_R1030_D008_S579.txt
- INMS_MS_2016-046_R1030_D008_S580.txt
- INMS_MS_2016-046_R1030_D008_S581.txt
- INMS_MS_2016-046_R1030_D008_S582.txt
- INMS_MS_2016-046_R1030_D008_S583.txt
- INMS_MS_2016-046_R1030_D008_S584.txt
- INMS_MS_2016-046_R1030_D008_S585.txt
- INMS_MS_2016-046_R1030_D008_S586.txt
- INMS_MS_2016-046_R1030_D008_S587.txt
- INMS_MS_2016-046_R1030_D008_S588.txt
- INMS_MS_2016-046_R1030_D008_S589.txt
- INMS_MS_2016-046_R1030_D008_S590.txt
- INMS_MS_2016-046_R1030_D008_S591.txt
- INMS_MS_2016-046_R1030_D008_S592.txt
- INMS_MS_2016-046_R1030_D008_S593.txt
- INMS_MS_2016-046_R1030_D008_S594.txt
- INMS_MS_2016-046_R1030_D008_S595.txt
- INMS_MS_2016-046_R1030_D008_S596.txt
- INMS_MS_2016-046_R1030_D008_S597.txt
- INMS_MS_2016-046_R1030_D008_S598.txt
- INMS_MS_2016-046_R1030_D008_S599.txt
- INMS_MS_2016-046_R1030_D008_S600.txt
- INMS_MS_2016-046_R1030_D008_S601.txt
- INMS_MS_2016-046_R1030_D008_S602.txt
- INMS_MS_2016-046_R1030_D008_S603.txt
- INMS_MS_2016-046_R1030_D008_S604.txt
- INMS_MS_2016-046_R1030_D008_S605.txt
- INMS_MS_2016-046_R1030_D008_S606.txt
- INMS_MS_2016-046_R1030_D008_S607.txt
- INMS_MS_2016-046_R1030_D008_S608.txt
- INMS_MS_2016-046_R1030_D008_S609.txt
- INMS_MS_2016-046_R1030_D008_S610.txt
- INMS_MS_2016-046_R1030_D008_S611.txt
- INMS_MS_2016-046_R1030_D008_S612.txt
- INMS_MS_2016-046_R1030_D008_S613.txt
- INMS_MS_2016-046_R1030_D008_S614.txt
- INMS_MS_2016-046_R1030_D008_S615.txt
- INMS_MS_2016-046_R1030_D008_S616.txt
- INMS_MS_2016-046_R1030_D008_S617.txt
- INMS_MS_2016-046_R1030_D008_S618.txt
- INMS_MS_2016-046_R1030_D008_S619.txt
- INMS_MS_2016-046_R1030_D008_S620.txt
- INMS_MS_2016-046_R1030_D008_S621.txt
- INMS_MS_2016-046_R1030_D008_S622.txt
- INMS_MS_2016-046_R1030_D008_S623.txt
- INMS_MS_2016-046_R1030_D008_S624.txt
- INMS_MS_2016-046_R1030_D008_S625.txt
- INMS_MS_2016-046_R1030_D008_S626.txt
- INMS_MS_2016-046_R1030_D008_S627.txt
- INMS_MS_2016-046_R1030_D008_S628.txt
- INMS_MS_2016-046_R1030_D008_S629.txt
- INMS_MS_2016-046_R1030_D008_S630.txt
- INMS_MS_2016-046_R1030_D008_S631.txt
- INMS_MS_2016-046_R1030_D008_S632.txt
- INMS_MS_2016-046_R1030_D008_S633.txt
- INMS_MS_2016-046_R1030_D008_S634.txt
- INMS_MS_2016-046_R1030_D008_S635.txt
- INMS_MS_2016-046_R1030_D008_S636.txt
- INMS_MS_2016-046_R1030_D008_S637.txt
- INMS_MS_2016-046_R1030_D008_S638.txt
- INMS_MS_2016-046_R1030_D008_S639.txt
- INMS_MS_2016-046_R1030_D008_S640.txt
- INMS_MS_2016-046_R1030_D008_S641.txt
- INMS_MS_2016-046_R1030_D008_S642.txt
- INMS_MS_2016-046_R1030_D008_S643.txt
- INMS_MS_2016-046_R1030_D008_S644.txt
- INMS_MS_2016-046_R1030_D008_S645.txt
- INMS_MS_2016-046_R1030_D008_S646.txt
- INMS_MS_2016-046_R1030_D008_S647.txt
- INMS_MS_2016-046_R1030_D008_S648.txt
- INMS_MS_2016-046_R1030_D008_S649.txt
- INMS_MS_2016-046_R1030_D008_S650.txt
- INMS_MS_2016-046_R1030_D008_S651.txt
- INMS_MS_2016-046_R1030_D008_S652.txt
- INMS_MS_2016-046_R1030_D008_S653.txt
- INMS_MS_2016-046_R1030_D008_S654.txt
- INMS_MS_2016-046_R1030_D008_S655.txt
- INMS_MS_2016-046_R1030_D008_S656.txt
- INMS_MS_2016-046_R1030_D009_S657.txt
- INMS_MS_2016-046_R1030_D009_S658.txt
- INMS_MS_2016-046_R1030_D009_S659.txt
- INMS_MS_2016-046_R1030_D009_S660.txt
- INMS_MS_2016-046_R1030_D009_S661.txt
- INMS_MS_2016-046_R1030_D009_S662.txt
- INMS_MS_2016-046_R1030_D009_S663.txt
- INMS_MS_2016-046_R1030_D009_S664.txt
- INMS_MS_2016-046_R1030_D009_S665.txt
- INMS_MS_2016-046_R1030_D009_S666.txt
- INMS_MS_2016-046_R1030_D009_S667.txt
- INMS_MS_2016-046_R1030_D009_S668.txt
- INMS_MS_2016-046_R1030_D009_S669.txt
- INMS_MS_2016-046_R1030_D009_S670.txt
- INMS_MS_2016-046_R1030_D009_S671.txt
- INMS_MS_2016-046_R1030_D009_S672.txt
- INMS_MS_2016-046_R1030_D009_S673.txt
- INMS_MS_2016-046_R1030_D009_S674.txt
- INMS_MS_2016-046_R1030_D009_S675.txt
- INMS_MS_2016-046_R1030_D009_S676.txt
- INMS_MS_2016-046_R1030_D009_S677.txt
- INMS_MS_2016-046_R1030_D009_S678.txt
- INMS_MS_2016-046_R1030_D009_S679.txt
- INMS_MS_2016-046_R1030_D009_S680.txt
- INMS_MS_2016-046_R1030_D009_S681.txt
- INMS_MS_2016-046_R1030_D009_S682.txt
- INMS_MS_2016-046_R1030_D009_S683.txt
- INMS_MS_2016-046_R1030_D009_S684.txt
- INMS_MS_2016-046_R1030_D009_S685.txt
- INMS_MS_2016-046_R1030_D009_S686.txt
- INMS_MS_2016-046_R1030_D009_S687.txt
- INMS_MS_2016-046_R1030_D009_S688.txt
- INMS_MS_2016-046_R1030_D009_S689.txt
- INMS_MS_2016-046_R1030_D009_S690.txt
- INMS_MS_2016-046_R1030_D009_S691.txt
- INMS_MS_2016-046_R1030_D009_S692.txt
- INMS_MS_2016-046_R1030_D009_S693.txt
- INMS_MS_2016-046_R1030_D009_S694.txt
- INMS_MS_2016-046_R1030_D009_S695.txt
- INMS_MS_2016-046_R1030_D009_S696.txt
- INMS_MS_2016-046_R1030_D009_S697.txt
- INMS_MS_2016-046_R1030_D009_S698.txt
- INMS_MS_2016-046_R1030_D009_S699.txt
- INMS_MS_2016-046_R1030_D009_S700.txt
- INMS_MS_2016-046_R1030_D009_S701.txt
- INMS_MS_2016-046_R1030_D009_S702.txt
- INMS_MS_2016-046_R1030_D009_S703.txt
- INMS_MS_2016-046_R1030_D009_S704.txt
- INMS_MS_2016-046_R1030_D009_S705.txt
- INMS_MS_2016-046_R1030_D009_S706.txt
- INMS_MS_2016-046_R1030_D009_S707.txt
- INMS_MS_2016-046_R1030_D009_S708.txt
- INMS_MS_2016-046_R1030_D009_S709.txt
- INMS_MS_2016-046_R1030_D009_S710.txt
- INMS_MS_2016-046_R1030_D009_S711.txt
- INMS_MS_2016-046_R1030_D009_S712.txt
- INMS_MS_2016-046_R1030_D009_S713.txt
- INMS_MS_2016-046_R1030_D009_S714.txt
- INMS_MS_2016-046_R1030_D009_S715.txt
- INMS_MS_2016-046_R1030_D009_S716.txt
- INMS_MS_2016-046_R1030_D009_S717.txt
- INMS_MS_2016-046_R1030_D009_S718.txt
- INMS_MS_2016-046_R1030_D009_S719.txt
- INMS_MS_2016-046_R1030_D009_S720.txt
- INMS_MS_2016-046_R1030_D009_S721.txt
- INMS_MS_2016-046_R1030_D009_S722.txt
- INMS_MS_2016-046_R1030_D009_S723.txt
- INMS_MS_2016-046_R1030_D009_S724.txt
- INMS_MS_2016-046_R1030_D009_S725.txt
- INMS_MS_2016-046_R1030_D009_S726.txt
- INMS_MS_2016-046_R1030_D009_S727.txt
- INMS_MS_2016-046_R1030_D009_S728.txt
- INMS_MS_2016-046_R1030_D009_S729.txt
- INMS_MS_2016-046_R1030_D009_S730.txt
- INMS_MS_2016-046_R1030_D009_S731.txt
- INMS_MS_2016-046_R1030_D009_S732.txt
- INMS_MS_2016-046_R1030_D009_S733.txt
- INMS_MS_2016-046_R1030_D009_S734.txt
- INMS_MS_2016-046_R1030_D009_S735.txt
- INMS_MS_2016-046_R1030_D009_S736.txt
- INMS_MS_2016-046_R1030_D010_S737.txt
- INMS_MS_2016-046_R1030_D010_S738.txt
- INMS_MS_2016-046_R1030_D010_S739.txt
- INMS_MS_2016-046_R1030_D010_S740.txt
- INMS_MS_2016-046_R1030_D010_S741.txt
- INMS_MS_2016-046_R1030_D010_S742.txt
- INMS_MS_2016-046_R1030_D010_S743.txt
- INMS_MS_2016-046_R1030_D010_S744.txt
- INMS_MS_2016-046_R1030_D010_S745.txt
- INMS_MS_2016-046_R1030_D010_S746.txt
- INMS_MS_2016-046_R1030_D010_S747.txt
- INMS_MS_2016-046_R1030_D010_S748.txt
- INMS_MS_2016-046_R1030_D010_S749.txt
- INMS_MS_2016-046_R1030_D010_S750.txt
- INMS_MS_2016-046_R1030_D010_S751.txt
- INMS_MS_2016-046_R1030_D010_S752.txt
- INMS_MS_2016-046_R1030_D010_S753.txt
- INMS_MS_2016-046_R1030_D010_S754.txt
- INMS_MS_2016-046_R1030_D010_S755.txt
- INMS_MS_2016-046_R1030_D010_S756.txt
- INMS_MS_2016-046_R1030_D010_S757.txt
- INMS_MS_2016-046_R1030_D010_S758.txt
- INMS_MS_2016-046_R1030_D010_S759.txt
- INMS_MS_2016-046_R1030_D010_S760.txt
- INMS_MS_2016-046_R1030_D010_S761.txt
- INMS_MS_2016-046_R1030_D010_S762.txt
- INMS_MS_2016-046_R1030_D010_S763.txt
- INMS_MS_2016-046_R1030_D010_S764.txt
- INMS_MS_2016-046_R1030_D010_S765.txt
- INMS_MS_2016-046_R1030_D010_S766.txt
- INMS_MS_2016-046_R1030_D010_S767.txt
- INMS_MS_2016-046_R1030_D010_S768.txt
- INMS_MS_2016-046_R1030_D010_S769.txt
- INMS_MS_2016-046_R1030_D010_S770.txt
- INMS_MS_2016-046_R1030_D010_S771.txt
- INMS_MS_2016-046_R1030_D010_S772.txt
- INMS_MS_2016-046_R1030_D010_S773.txt
- INMS_MS_2016-046_R1030_D010_S774.txt
- INMS_MS_2016-046_R1030_D010_S775.txt
- INMS_MS_2016-046_R1030_D010_S776.txt
- INMS_MS_2016-046_R1030_D010_S777.txt
- INMS_MS_2016-046_R1030_D010_S778.txt
- INMS_MS_2016-046_R1030_D010_S779.txt
- INMS_MS_2016-046_R1030_D010_S780.txt
- INMS_MS_2016-046_R1030_D010_S781.txt
- INMS_MS_2016-046_R1030_D010_S782.txt
- INMS_MS_2016-046_R1030_D010_S783.txt
- INMS_MS_2016-046_R1030_D010_S784.txt
- INMS_MS_2016-046_R1030_D010_S785.txt
- INMS_MS_2016-046_R1030_D010_S786.txt
- INMS_MS_2016-046_R1030_D010_S787.txt
- INMS_MS_2016-046_R1030_D010_S788.txt
- INMS_MS_2016-046_R1030_D010_S789.txt
- INMS_MS_2016-046_R1030_D010_S790.txt
- INMS_MS_2016-046_R1030_D010_S791.txt
- INMS_MS_2016-046_R1030_D010_S792.txt
- INMS_MS_2016-046_R1030_D010_S793.txt
- INMS_MS_2016-046_R1030_D010_S794.txt
- INMS_MS_2016-046_R1030_D010_S795.txt
- INMS_MS_2016-046_R1030_D010_S796.txt
- INMS_MS_2016-046_R1030_D010_S797.txt
- INMS_MS_2016-046_R1030_D010_S798.txt
- INMS_MS_2016-046_R1030_D010_S799.txt
- INMS_MS_2016-046_R1030_D010_S800.txt
- INMS_MS_2016-046_R1030_D010_S801.txt
- INMS_MS_2016-046_R1030_D010_S802.txt
- INMS_MS_2016-046_R1030_D010_S803.txt
- INMS_MS_2016-046_R1030_D010_S804.txt
- INMS_MS_2016-046_R1030_D010_S805.txt
- INMS_MS_2016-046_R1030_D010_S806.txt
- INMS_MS_2016-046_R1030_D010_S807.txt
- INMS_MS_2016-046_R1030_D010_S808.txt
- INMS_MS_2016-046_R1030_D010_S809.txt
- INMS_MS_2016-046_R1030_D010_S810.txt
- INMS_MS_2016-046_R1030_D010_S811.txt
- INMS_MS_2016-046_R1030_D010_S812.txt
- INMS_MS_2016-046_R1030_D010_S813.txt
- INMS_MS_2016-046_R1030_D010_S814.txt
- INMS_MS_2016-046_R1030_D010_S815.txt
- INMS_MS_2016-046_R1030_D010_S816.txt
- INMS_JN_2016-048_R1031.txt
- INMS_JN_2016-048_R1032.txt
- INMS_LG_2016-048.txt
- INMS_MN_2016-048_R1031.txt
- INMS_MN_2016-048_R1032.txt
- INMS_MS_2016-048_R1032_D000_S161.txt
- INMS_MS_2016-048_R1032_D000_S162.txt
- INMS_MS_2016-048_R1032_D004_S001.txt
- INMS_MS_2016-048_R1032_D004_S002.txt
- INMS_MS_2016-048_R1032_D004_S003.txt
- INMS_MS_2016-048_R1032_D004_S004.txt
- INMS_MS_2016-048_R1032_D004_S005.txt
- INMS_MS_2016-048_R1032_D004_S006.txt
- INMS_MS_2016-048_R1032_D004_S007.txt
- INMS_MS_2016-048_R1032_D004_S008.txt
- INMS_MS_2016-048_R1032_D004_S009.txt
- INMS_MS_2016-048_R1032_D004_S010.txt
- INMS_MS_2016-048_R1032_D004_S011.txt
- INMS_MS_2016-048_R1032_D004_S012.txt
- INMS_MS_2016-048_R1032_D004_S013.txt
- INMS_MS_2016-048_R1032_D004_S014.txt
- INMS_MS_2016-048_R1032_D004_S015.txt
- INMS_MS_2016-048_R1032_D004_S016.txt
- INMS_MS_2016-048_R1032_D004_S017.txt
- INMS_MS_2016-048_R1032_D004_S018.txt
- INMS_MS_2016-048_R1032_D004_S019.txt
- INMS_MS_2016-048_R1032_D004_S020.txt
- INMS_MS_2016-048_R1032_D004_S021.txt
- INMS_MS_2016-048_R1032_D004_S022.txt
- INMS_MS_2016-048_R1032_D004_S023.txt
- INMS_MS_2016-048_R1032_D004_S024.txt
- INMS_MS_2016-048_R1032_D004_S025.txt
- INMS_MS_2016-048_R1032_D004_S026.txt
- INMS_MS_2016-048_R1032_D004_S027.txt
- INMS_MS_2016-048_R1032_D004_S028.txt
- INMS_MS_2016-048_R1032_D004_S029.txt
- INMS_MS_2016-048_R1032_D004_S030.txt
- INMS_MS_2016-048_R1032_D004_S031.txt
- INMS_MS_2016-048_R1032_D004_S032.txt
- INMS_MS_2016-048_R1032_D004_S033.txt
- INMS_MS_2016-048_R1032_D004_S034.txt
- INMS_MS_2016-048_R1032_D004_S035.txt
- INMS_MS_2016-048_R1032_D004_S036.txt
- INMS_MS_2016-048_R1032_D004_S037.txt
- INMS_MS_2016-048_R1032_D004_S038.txt
- INMS_MS_2016-048_R1032_D004_S039.txt
- INMS_MS_2016-048_R1032_D004_S040.txt
- INMS_MS_2016-048_R1032_D004_S041.txt
- INMS_MS_2016-048_R1032_D004_S042.txt
- INMS_MS_2016-048_R1032_D004_S043.txt
- INMS_MS_2016-048_R1032_D004_S044.txt
- INMS_MS_2016-048_R1032_D004_S045.txt
- INMS_MS_2016-048_R1032_D004_S046.txt
- INMS_MS_2016-048_R1032_D004_S047.txt
- INMS_MS_2016-048_R1032_D004_S048.txt
- INMS_MS_2016-048_R1032_D004_S049.txt
- INMS_MS_2016-048_R1032_D004_S050.txt
- INMS_MS_2016-048_R1032_D004_S051.txt
- INMS_MS_2016-048_R1032_D004_S052.txt
- INMS_MS_2016-048_R1032_D004_S053.txt
- INMS_MS_2016-048_R1032_D004_S054.txt
- INMS_MS_2016-048_R1032_D004_S055.txt
- INMS_MS_2016-048_R1032_D004_S056.txt
- INMS_MS_2016-048_R1032_D004_S057.txt
- INMS_MS_2016-048_R1032_D004_S058.txt
- INMS_MS_2016-048_R1032_D004_S059.txt
- INMS_MS_2016-048_R1032_D004_S060.txt
- INMS_MS_2016-048_R1032_D004_S061.txt
- INMS_MS_2016-048_R1032_D004_S062.txt
- INMS_MS_2016-048_R1032_D004_S063.txt
- INMS_MS_2016-048_R1032_D004_S064.txt
- INMS_MS_2016-048_R1032_D004_S065.txt
- INMS_MS_2016-048_R1032_D004_S066.txt
- INMS_MS_2016-048_R1032_D004_S067.txt
- INMS_MS_2016-048_R1032_D004_S068.txt
- INMS_MS_2016-048_R1032_D004_S069.txt
- INMS_MS_2016-048_R1032_D004_S070.txt
- INMS_MS_2016-048_R1032_D004_S071.txt
- INMS_MS_2016-048_R1032_D004_S072.txt
- INMS_MS_2016-048_R1032_D004_S073.txt
- INMS_MS_2016-048_R1032_D004_S074.txt
- INMS_MS_2016-048_R1032_D004_S075.txt
- INMS_MS_2016-048_R1032_D004_S076.txt
- INMS_MS_2016-048_R1032_D004_S077.txt
- INMS_MS_2016-048_R1032_D004_S078.txt
- INMS_MS_2016-048_R1032_D004_S079.txt
- INMS_MS_2016-048_R1032_D004_S080.txt
- INMS_MS_2016-048_R1032_D005_S081.txt
- INMS_MS_2016-048_R1032_D005_S082.txt
- INMS_MS_2016-048_R1032_D005_S083.txt
- INMS_MS_2016-048_R1032_D005_S084.txt
- INMS_MS_2016-048_R1032_D005_S085.txt
- INMS_MS_2016-048_R1032_D005_S086.txt
- INMS_MS_2016-048_R1032_D005_S087.txt
- INMS_MS_2016-048_R1032_D005_S088.txt
- INMS_MS_2016-048_R1032_D005_S089.txt
- INMS_MS_2016-048_R1032_D005_S090.txt
- INMS_MS_2016-048_R1032_D005_S091.txt
- INMS_MS_2016-048_R1032_D005_S092.txt
- INMS_MS_2016-048_R1032_D005_S093.txt
- INMS_MS_2016-048_R1032_D005_S094.txt
- INMS_MS_2016-048_R1032_D005_S095.txt
- INMS_MS_2016-048_R1032_D005_S096.txt
- INMS_MS_2016-048_R1032_D005_S097.txt
- INMS_MS_2016-048_R1032_D005_S098.txt
- INMS_MS_2016-048_R1032_D005_S099.txt
- INMS_MS_2016-048_R1032_D005_S100.txt
- INMS_MS_2016-048_R1032_D005_S101.txt
- INMS_MS_2016-048_R1032_D005_S102.txt
- INMS_MS_2016-048_R1032_D005_S103.txt
- INMS_MS_2016-048_R1032_D005_S104.txt
- INMS_MS_2016-048_R1032_D005_S105.txt
- INMS_MS_2016-048_R1032_D005_S106.txt
- INMS_MS_2016-048_R1032_D005_S107.txt
- INMS_MS_2016-048_R1032_D005_S108.txt
- INMS_MS_2016-048_R1032_D005_S109.txt
- INMS_MS_2016-048_R1032_D005_S110.txt
- INMS_MS_2016-048_R1032_D005_S111.txt
- INMS_MS_2016-048_R1032_D005_S112.txt
- INMS_MS_2016-048_R1032_D005_S113.txt
- INMS_MS_2016-048_R1032_D005_S114.txt
- INMS_MS_2016-048_R1032_D005_S115.txt
- INMS_MS_2016-048_R1032_D005_S116.txt
- INMS_MS_2016-048_R1032_D005_S117.txt
- INMS_MS_2016-048_R1032_D005_S118.txt
- INMS_MS_2016-048_R1032_D005_S119.txt
- INMS_MS_2016-048_R1032_D005_S120.txt
- INMS_MS_2016-048_R1032_D005_S121.txt
- INMS_MS_2016-048_R1032_D005_S122.txt
- INMS_MS_2016-048_R1032_D005_S123.txt
- INMS_MS_2016-048_R1032_D005_S124.txt
- INMS_MS_2016-048_R1032_D005_S125.txt
- INMS_MS_2016-048_R1032_D005_S126.txt
- INMS_MS_2016-048_R1032_D005_S127.txt
- INMS_MS_2016-048_R1032_D005_S128.txt
- INMS_MS_2016-048_R1032_D005_S129.txt
- INMS_MS_2016-048_R1032_D005_S130.txt
- INMS_MS_2016-048_R1032_D005_S131.txt
- INMS_MS_2016-048_R1032_D005_S132.txt
- INMS_MS_2016-048_R1032_D005_S133.txt
- INMS_MS_2016-048_R1032_D005_S134.txt
- INMS_MS_2016-048_R1032_D005_S135.txt
- INMS_MS_2016-048_R1032_D005_S136.txt
- INMS_MS_2016-048_R1032_D005_S137.txt
- INMS_MS_2016-048_R1032_D005_S138.txt
- INMS_MS_2016-048_R1032_D005_S139.txt
- INMS_MS_2016-048_R1032_D005_S140.txt
- INMS_MS_2016-048_R1032_D005_S141.txt
- INMS_MS_2016-048_R1032_D005_S142.txt
- INMS_MS_2016-048_R1032_D005_S143.txt
- INMS_MS_2016-048_R1032_D005_S144.txt
- INMS_MS_2016-048_R1032_D005_S145.txt
- INMS_MS_2016-048_R1032_D005_S146.txt
- INMS_MS_2016-048_R1032_D005_S147.txt
- INMS_MS_2016-048_R1032_D005_S148.txt
- INMS_MS_2016-048_R1032_D005_S149.txt
- INMS_MS_2016-048_R1032_D005_S150.txt
- INMS_MS_2016-048_R1032_D005_S151.txt
- INMS_MS_2016-048_R1032_D005_S152.txt
- INMS_MS_2016-048_R1032_D005_S153.txt
- INMS_MS_2016-048_R1032_D005_S154.txt
- INMS_MS_2016-048_R1032_D005_S155.txt
- INMS_MS_2016-048_R1032_D005_S156.txt
- INMS_MS_2016-048_R1032_D005_S157.txt
- INMS_MS_2016-048_R1032_D005_S158.txt
- INMS_MS_2016-048_R1032_D005_S159.txt
- INMS_MS_2016-048_R1032_D005_S160.txt
- INMS_MS_2016-048_R1032_D006_S163.txt
- INMS_MS_2016-048_R1032_D006_S164.txt
- INMS_MS_2016-048_R1032_D006_S165.txt
- INMS_MS_2016-048_R1032_D006_S166.txt
- INMS_MS_2016-048_R1032_D006_S167.txt
- INMS_MS_2016-048_R1032_D006_S168.txt
- INMS_MS_2016-048_R1032_D006_S169.txt
- INMS_MS_2016-048_R1032_D006_S170.txt
- INMS_MS_2016-048_R1032_D006_S171.txt
- INMS_MS_2016-048_R1032_D006_S172.txt
- INMS_MS_2016-048_R1032_D006_S173.txt
- INMS_MS_2016-048_R1032_D006_S174.txt
- INMS_MS_2016-048_R1032_D006_S175.txt
- INMS_MS_2016-048_R1032_D006_S176.txt
- INMS_MS_2016-048_R1032_D006_S177.txt
- INMS_MS_2016-048_R1032_D006_S178.txt
- INMS_MS_2016-048_R1032_D006_S179.txt
- INMS_MS_2016-048_R1032_D006_S180.txt
- INMS_MS_2016-048_R1032_D006_S181.txt
- INMS_MS_2016-048_R1032_D006_S182.txt
- INMS_MS_2016-048_R1032_D006_S183.txt
- INMS_MS_2016-048_R1032_D006_S184.txt
- INMS_MS_2016-048_R1032_D006_S185.txt
- INMS_MS_2016-048_R1032_D006_S186.txt
- INMS_MS_2016-048_R1032_D006_S187.txt
- INMS_MS_2016-048_R1032_D006_S188.txt
- INMS_MS_2016-048_R1032_D006_S189.txt
- INMS_MS_2016-048_R1032_D006_S190.txt
- INMS_MS_2016-048_R1032_D006_S191.txt
- INMS_MS_2016-048_R1032_D006_S192.txt
- INMS_MS_2016-048_R1032_D006_S193.txt
- INMS_MS_2016-048_R1032_D006_S194.txt
- INMS_MS_2016-048_R1032_D006_S195.txt
- INMS_MS_2016-048_R1032_D006_S196.txt
- INMS_MS_2016-048_R1032_D006_S197.txt
- INMS_MS_2016-048_R1032_D006_S198.txt
- INMS_MS_2016-048_R1032_D006_S199.txt
- INMS_MS_2016-048_R1032_D006_S200.txt
- INMS_MS_2016-048_R1032_D006_S201.txt
- INMS_MS_2016-048_R1032_D006_S202.txt
- INMS_MS_2016-048_R1032_D006_S203.txt
- INMS_MS_2016-048_R1032_D006_S204.txt
- INMS_MS_2016-048_R1032_D006_S205.txt
- INMS_MS_2016-048_R1032_D006_S206.txt
- INMS_MS_2016-048_R1032_D006_S207.txt
- INMS_MS_2016-048_R1032_D006_S208.txt
- INMS_MS_2016-048_R1032_D006_S209.txt
- INMS_MS_2016-048_R1032_D006_S210.txt
- INMS_MS_2016-048_R1032_D006_S211.txt
- INMS_MS_2016-048_R1032_D006_S212.txt
- INMS_MS_2016-048_R1032_D006_S213.txt
- INMS_MS_2016-048_R1032_D006_S214.txt
- INMS_MS_2016-048_R1032_D006_S215.txt
- INMS_MS_2016-048_R1032_D006_S216.txt
- INMS_MS_2016-048_R1032_D006_S217.txt
- INMS_MS_2016-048_R1032_D006_S218.txt
- INMS_MS_2016-048_R1032_D006_S219.txt
- INMS_MS_2016-048_R1032_D006_S220.txt
- INMS_MS_2016-048_R1032_D006_S221.txt
- INMS_MS_2016-048_R1032_D006_S222.txt
- INMS_MS_2016-048_R1032_D006_S223.txt
- INMS_MS_2016-048_R1032_D006_S224.txt
- INMS_MS_2016-048_R1032_D006_S225.txt
- INMS_MS_2016-048_R1032_D006_S226.txt
- INMS_MS_2016-048_R1032_D006_S227.txt
- INMS_MS_2016-048_R1032_D006_S228.txt
- INMS_MS_2016-048_R1032_D006_S229.txt
- INMS_MS_2016-048_R1032_D006_S230.txt
- INMS_MS_2016-048_R1032_D006_S231.txt
- INMS_MS_2016-048_R1032_D006_S232.txt
- INMS_MS_2016-048_R1032_D006_S233.txt
- INMS_MS_2016-048_R1032_D006_S234.txt
- INMS_MS_2016-048_R1032_D006_S235.txt
- INMS_MS_2016-048_R1032_D006_S236.txt
- INMS_MS_2016-048_R1032_D006_S237.txt
- INMS_MS_2016-048_R1032_D006_S238.txt
- INMS_MS_2016-048_R1032_D006_S239.txt
- INMS_MS_2016-048_R1032_D006_S240.txt
- INMS_MS_2016-048_R1032_D006_S241.txt
- INMS_MS_2016-048_R1032_D006_S242.txt
- INMS_MS_2016-048_R1032_D007_S243.txt
- INMS_MS_2016-048_R1032_D007_S244.txt
- INMS_MS_2016-048_R1032_D007_S245.txt
- INMS_MS_2016-048_R1032_D007_S246.txt
- INMS_MS_2016-048_R1032_D007_S247.txt
- INMS_MS_2016-048_R1032_D007_S248.txt
- INMS_MS_2016-048_R1032_D007_S249.txt
- INMS_MS_2016-048_R1032_D007_S250.txt
- INMS_MS_2016-048_R1032_D007_S251.txt
- INMS_MS_2016-048_R1032_D007_S252.txt
- INMS_MS_2016-048_R1032_D007_S253.txt
- INMS_MS_2016-048_R1032_D007_S254.txt
- INMS_MS_2016-048_R1032_D007_S255.txt
- INMS_MS_2016-048_R1032_D007_S256.txt
- INMS_MS_2016-048_R1032_D007_S257.txt
- INMS_MS_2016-048_R1032_D007_S258.txt
- INMS_MS_2016-048_R1032_D007_S259.txt
- INMS_MS_2016-048_R1032_D007_S260.txt
- INMS_MS_2016-048_R1032_D007_S261.txt
- INMS_MS_2016-048_R1032_D007_S262.txt
- INMS_MS_2016-048_R1032_D007_S263.txt
- INMS_MS_2016-048_R1032_D007_S264.txt
- INMS_MS_2016-048_R1032_D007_S265.txt
- INMS_MS_2016-048_R1032_D007_S266.txt
- INMS_MS_2016-048_R1032_D007_S267.txt
- INMS_MS_2016-048_R1032_D007_S268.txt
- INMS_MS_2016-048_R1032_D007_S269.txt
- INMS_MS_2016-048_R1032_D007_S270.txt
- INMS_MS_2016-048_R1032_D007_S271.txt
- INMS_MS_2016-048_R1032_D007_S272.txt
- INMS_MS_2016-048_R1032_D007_S273.txt
- INMS_MS_2016-048_R1032_D007_S274.txt
- INMS_MS_2016-048_R1032_D007_S275.txt
- INMS_MS_2016-048_R1032_D007_S276.txt
- INMS_MS_2016-048_R1032_D007_S277.txt
- INMS_MS_2016-048_R1032_D007_S278.txt
- INMS_MS_2016-048_R1032_D007_S279.txt
- INMS_MS_2016-048_R1032_D007_S280.txt
- INMS_MS_2016-048_R1032_D007_S281.txt
- INMS_MS_2016-048_R1032_D007_S282.txt
- INMS_MS_2016-048_R1032_D007_S283.txt
- INMS_MS_2016-048_R1032_D007_S284.txt
- INMS_MS_2016-048_R1032_D007_S285.txt
- INMS_MS_2016-048_R1032_D007_S286.txt
- INMS_MS_2016-048_R1032_D007_S287.txt
- INMS_MS_2016-048_R1032_D007_S288.txt
- INMS_MS_2016-048_R1032_D007_S289.txt
- INMS_MS_2016-048_R1032_D007_S290.txt
- INMS_MS_2016-048_R1032_D007_S291.txt
- INMS_MS_2016-048_R1032_D007_S292.txt
- INMS_MS_2016-048_R1032_D007_S293.txt
- INMS_MS_2016-048_R1032_D007_S294.txt
- INMS_MS_2016-048_R1032_D007_S295.txt
- INMS_MS_2016-048_R1032_D007_S296.txt
- INMS_MS_2016-048_R1032_D007_S297.txt
- INMS_MS_2016-048_R1032_D007_S298.txt
- INMS_MS_2016-048_R1032_D007_S299.txt
- INMS_MS_2016-048_R1032_D007_S300.txt
- INMS_MS_2016-048_R1032_D007_S301.txt
- INMS_MS_2016-048_R1032_D007_S302.txt
- INMS_MS_2016-048_R1032_D007_S303.txt
- INMS_MS_2016-048_R1032_D007_S304.txt
- INMS_MS_2016-048_R1032_D007_S305.txt
- INMS_MS_2016-048_R1032_D007_S306.txt
- INMS_MS_2016-048_R1032_D007_S307.txt
- INMS_MS_2016-048_R1032_D007_S308.txt
- INMS_MS_2016-048_R1032_D007_S309.txt
- INMS_MS_2016-048_R1032_D007_S310.txt
- INMS_MS_2016-048_R1032_D007_S311.txt
- INMS_MS_2016-048_R1032_D007_S312.txt
- INMS_MS_2016-048_R1032_D007_S313.txt
- INMS_MS_2016-048_R1032_D007_S314.txt
- INMS_MS_2016-048_R1032_D007_S315.txt
- INMS_MS_2016-048_R1032_D007_S316.txt
- INMS_MS_2016-048_R1032_D007_S317.txt
- INMS_MS_2016-048_R1032_D007_S318.txt
- INMS_MS_2016-048_R1032_D007_S319.txt
- INMS_MS_2016-048_R1032_D007_S320.txt
- INMS_MS_2016-048_R1032_D007_S321.txt
- INMS_MS_2016-048_R1032_D007_S322.txt
- INMS_MS_2016-048_R1032_D008_S323.txt
- INMS_MS_2016-048_R1032_D008_S324.txt
- INMS_MS_2016-048_R1032_D008_S325.txt
- INMS_MS_2016-048_R1032_D008_S326.txt
- INMS_MS_2016-048_R1032_D008_S327.txt
- INMS_MS_2016-048_R1032_D008_S328.txt
- INMS_MS_2016-048_R1032_D008_S329.txt
- INMS_MS_2016-048_R1032_D008_S330.txt
- INMS_MS_2016-048_R1032_D008_S331.txt
- INMS_MS_2016-048_R1032_D008_S332.txt
- INMS_MS_2016-048_R1032_D008_S333.txt
- INMS_MS_2016-048_R1032_D008_S334.txt
- INMS_MS_2016-048_R1032_D008_S335.txt
- INMS_MS_2016-048_R1032_D008_S336.txt
- INMS_MS_2016-048_R1032_D008_S337.txt
- INMS_MS_2016-048_R1032_D008_S338.txt
- INMS_MS_2016-048_R1032_D008_S339.txt
- INMS_MS_2016-048_R1032_D008_S340.txt
- INMS_MS_2016-048_R1032_D008_S341.txt
- INMS_MS_2016-048_R1032_D008_S342.txt
- INMS_MS_2016-048_R1032_D008_S343.txt
- INMS_MS_2016-048_R1032_D008_S344.txt
- INMS_MS_2016-048_R1032_D008_S345.txt
- INMS_MS_2016-048_R1032_D008_S346.txt
- INMS_MS_2016-048_R1032_D008_S347.txt
- INMS_MS_2016-048_R1032_D008_S348.txt
- INMS_MS_2016-048_R1032_D008_S349.txt
- INMS_MS_2016-048_R1032_D008_S350.txt
- INMS_MS_2016-048_R1032_D008_S351.txt
- INMS_MS_2016-048_R1032_D008_S352.txt
- INMS_MS_2016-048_R1032_D008_S353.txt
- INMS_MS_2016-048_R1032_D008_S354.txt
- INMS_MS_2016-048_R1032_D008_S355.txt
- INMS_MS_2016-048_R1032_D008_S356.txt
- INMS_MS_2016-048_R1032_D008_S357.txt
- INMS_MS_2016-048_R1032_D008_S358.txt
- INMS_MS_2016-048_R1032_D008_S359.txt
- INMS_MS_2016-048_R1032_D008_S360.txt
- INMS_MS_2016-048_R1032_D008_S361.txt
- INMS_MS_2016-048_R1032_D008_S362.txt
- INMS_MS_2016-048_R1032_D008_S363.txt
- INMS_MS_2016-048_R1032_D008_S364.txt
- INMS_MS_2016-048_R1032_D008_S365.txt
- INMS_MS_2016-048_R1032_D008_S366.txt
- INMS_MS_2016-048_R1032_D008_S367.txt
- INMS_MS_2016-048_R1032_D008_S368.txt
- INMS_MS_2016-048_R1032_D008_S369.txt
- INMS_MS_2016-048_R1032_D008_S370.txt
- INMS_MS_2016-048_R1032_D008_S371.txt
- INMS_MS_2016-048_R1032_D008_S372.txt
- INMS_MS_2016-048_R1032_D008_S373.txt
- INMS_MS_2016-048_R1032_D008_S374.txt
- INMS_MS_2016-048_R1032_D008_S375.txt
- INMS_MS_2016-048_R1032_D008_S376.txt
- INMS_MS_2016-048_R1032_D008_S377.txt
- INMS_MS_2016-048_R1032_D008_S378.txt
- INMS_MS_2016-048_R1032_D008_S379.txt
- INMS_MS_2016-048_R1032_D008_S380.txt
- INMS_MS_2016-048_R1032_D008_S381.txt
- INMS_MS_2016-048_R1032_D008_S382.txt
- INMS_MS_2016-048_R1032_D008_S383.txt
- INMS_MS_2016-048_R1032_D008_S384.txt
- INMS_MS_2016-048_R1032_D008_S385.txt
- INMS_MS_2016-048_R1032_D008_S386.txt
- INMS_MS_2016-048_R1032_D008_S387.txt
- INMS_MS_2016-048_R1032_D008_S388.txt
- INMS_MS_2016-048_R1032_D008_S389.txt
- INMS_MS_2016-048_R1032_D008_S390.txt
- INMS_MS_2016-048_R1032_D008_S391.txt
- INMS_MS_2016-048_R1032_D008_S392.txt
- INMS_MS_2016-048_R1032_D008_S393.txt
- INMS_MS_2016-048_R1032_D008_S394.txt
- INMS_MS_2016-048_R1032_D008_S395.txt
- INMS_MS_2016-048_R1032_D008_S396.txt
- INMS_MS_2016-048_R1032_D008_S397.txt
- INMS_MS_2016-048_R1032_D008_S398.txt
- INMS_MS_2016-048_R1032_D008_S399.txt
- INMS_MS_2016-048_R1032_D008_S400.txt
- INMS_MS_2016-048_R1032_D008_S401.txt
- INMS_MS_2016-048_R1032_D008_S402.txt
- INMS_MS_2016-048_R1032_D009_S403.txt
- INMS_MS_2016-048_R1032_D009_S404.txt
- INMS_MS_2016-048_R1032_D009_S405.txt
- INMS_MS_2016-048_R1032_D009_S406.txt
- INMS_MS_2016-048_R1032_D009_S407.txt
- INMS_MS_2016-048_R1032_D009_S408.txt
- INMS_MS_2016-048_R1032_D009_S409.txt
- INMS_MS_2016-048_R1032_D009_S410.txt
- INMS_MS_2016-048_R1032_D009_S411.txt
- INMS_MS_2016-048_R1032_D009_S412.txt
- INMS_MS_2016-048_R1032_D009_S413.txt
- INMS_MS_2016-048_R1032_D009_S414.txt
- INMS_MS_2016-048_R1032_D009_S415.txt
- INMS_MS_2016-048_R1032_D009_S416.txt
- INMS_MS_2016-048_R1032_D009_S417.txt
- INMS_MS_2016-048_R1032_D009_S418.txt
- INMS_MS_2016-048_R1032_D009_S419.txt
- INMS_MS_2016-048_R1032_D009_S420.txt
- INMS_MS_2016-048_R1032_D009_S421.txt
- INMS_MS_2016-048_R1032_D009_S422.txt
- INMS_MS_2016-048_R1032_D009_S423.txt
- INMS_MS_2016-048_R1032_D009_S424.txt
- INMS_MS_2016-048_R1032_D009_S425.txt
- INMS_MS_2016-048_R1032_D009_S426.txt
- INMS_MS_2016-048_R1032_D009_S427.txt
- INMS_MS_2016-048_R1032_D009_S428.txt
- INMS_MS_2016-048_R1032_D009_S429.txt
- INMS_MS_2016-048_R1032_D009_S430.txt
- INMS_MS_2016-048_R1032_D009_S431.txt
- INMS_MS_2016-048_R1032_D009_S432.txt
- INMS_MS_2016-048_R1032_D009_S433.txt
- INMS_MS_2016-048_R1032_D009_S434.txt
- INMS_MS_2016-048_R1032_D009_S435.txt
- INMS_MS_2016-048_R1032_D009_S436.txt
- INMS_MS_2016-048_R1032_D009_S437.txt
- INMS_MS_2016-048_R1032_D009_S438.txt
- INMS_MS_2016-048_R1032_D009_S439.txt
- INMS_MS_2016-048_R1032_D009_S440.txt
- INMS_MS_2016-048_R1032_D009_S441.txt
- INMS_MS_2016-048_R1032_D009_S442.txt
- INMS_MS_2016-048_R1032_D009_S443.txt
- INMS_MS_2016-048_R1032_D009_S444.txt
- INMS_MS_2016-048_R1032_D009_S445.txt
- INMS_MS_2016-048_R1032_D009_S446.txt
- INMS_MS_2016-048_R1032_D009_S447.txt
- INMS_MS_2016-048_R1032_D009_S448.txt
- INMS_MS_2016-048_R1032_D009_S449.txt
- INMS_MS_2016-048_R1032_D009_S450.txt
- INMS_MS_2016-048_R1032_D009_S451.txt
- INMS_MS_2016-048_R1032_D009_S452.txt
- INMS_MS_2016-048_R1032_D009_S453.txt
- INMS_MS_2016-048_R1032_D009_S454.txt
- INMS_MS_2016-048_R1032_D009_S455.txt
- INMS_MS_2016-048_R1032_D009_S456.txt
- INMS_MS_2016-048_R1032_D009_S457.txt
- INMS_MS_2016-048_R1032_D009_S458.txt
- INMS_MS_2016-048_R1032_D009_S459.txt
- INMS_MS_2016-048_R1032_D009_S460.txt
- INMS_MS_2016-048_R1032_D009_S461.txt
- INMS_MS_2016-048_R1032_D009_S462.txt
- INMS_MS_2016-048_R1032_D009_S463.txt
- INMS_MS_2016-048_R1032_D009_S464.txt
- INMS_MS_2016-048_R1032_D009_S465.txt
- INMS_MS_2016-048_R1032_D009_S466.txt
- INMS_MS_2016-048_R1032_D009_S467.txt
- INMS_MS_2016-048_R1032_D009_S468.txt
- INMS_MS_2016-048_R1032_D009_S469.txt
- INMS_MS_2016-048_R1032_D009_S470.txt
- INMS_MS_2016-048_R1032_D009_S471.txt
- INMS_MS_2016-048_R1032_D009_S472.txt
- INMS_MS_2016-048_R1032_D009_S473.txt
- INMS_MS_2016-048_R1032_D009_S474.txt
- INMS_MS_2016-048_R1032_D009_S475.txt
- INMS_MS_2016-048_R1032_D009_S476.txt
- INMS_MS_2016-048_R1032_D009_S477.txt
- INMS_MS_2016-048_R1032_D009_S478.txt
- INMS_MS_2016-048_R1032_D009_S479.txt
- INMS_MS_2016-048_R1032_D009_S480.txt
- INMS_MS_2016-048_R1032_D009_S481.txt
- INMS_MS_2016-048_R1032_D009_S482.txt
- INMS_MS_2016-048_R1032_D010_S483.txt
- INMS_MS_2016-048_R1032_D010_S484.txt
- INMS_MS_2016-048_R1032_D010_S485.txt
- INMS_MS_2016-048_R1032_D010_S486.txt
- INMS_MS_2016-048_R1032_D010_S487.txt
- INMS_MS_2016-048_R1032_D010_S488.txt
- INMS_MS_2016-048_R1032_D010_S489.txt
- INMS_MS_2016-048_R1032_D010_S490.txt
- INMS_MS_2016-048_R1032_D010_S491.txt
- INMS_MS_2016-048_R1032_D010_S492.txt
- INMS_MS_2016-048_R1032_D010_S493.txt
- INMS_MS_2016-048_R1032_D010_S494.txt
- INMS_MS_2016-048_R1032_D010_S495.txt
- INMS_MS_2016-048_R1032_D010_S496.txt
- INMS_MS_2016-048_R1032_D010_S497.txt
- INMS_MS_2016-048_R1032_D010_S498.txt
- INMS_MS_2016-048_R1032_D010_S499.txt
- INMS_MS_2016-048_R1032_D010_S500.txt
- INMS_MS_2016-048_R1032_D010_S501.txt
- INMS_MS_2016-048_R1032_D010_S502.txt
- INMS_MS_2016-048_R1032_D010_S503.txt
- INMS_MS_2016-048_R1032_D010_S504.txt
- INMS_MS_2016-048_R1032_D010_S505.txt
- INMS_MS_2016-048_R1032_D010_S506.txt
- INMS_MS_2016-048_R1032_D010_S507.txt
- INMS_MS_2016-048_R1032_D010_S508.txt
- INMS_MS_2016-048_R1032_D010_S509.txt
- INMS_MS_2016-048_R1032_D010_S510.txt
- INMS_MS_2016-048_R1032_D010_S511.txt
- INMS_MS_2016-048_R1032_D010_S512.txt
- INMS_MS_2016-048_R1032_D010_S513.txt
- INMS_MS_2016-048_R1032_D010_S514.txt
- INMS_MS_2016-048_R1032_D010_S515.txt
- INMS_MS_2016-048_R1032_D010_S516.txt
- INMS_MS_2016-048_R1032_D010_S517.txt
- INMS_MS_2016-048_R1032_D010_S518.txt
- INMS_MS_2016-048_R1032_D010_S519.txt
- INMS_MS_2016-048_R1032_D010_S520.txt
- INMS_MS_2016-048_R1032_D010_S521.txt
- INMS_MS_2016-048_R1032_D010_S522.txt
- INMS_MS_2016-048_R1032_D010_S523.txt
- INMS_MS_2016-048_R1032_D010_S524.txt
- INMS_MS_2016-048_R1032_D010_S525.txt
- INMS_MS_2016-048_R1032_D010_S526.txt
- INMS_MS_2016-048_R1032_D010_S527.txt
- INMS_MS_2016-048_R1032_D010_S528.txt
- INMS_MS_2016-048_R1032_D010_S529.txt
- INMS_MS_2016-048_R1032_D010_S530.txt
- INMS_MS_2016-048_R1032_D010_S531.txt
- INMS_MS_2016-048_R1032_D010_S532.txt
- INMS_MS_2016-048_R1032_D010_S533.txt
- INMS_MS_2016-048_R1032_D010_S534.txt
- INMS_MS_2016-048_R1032_D010_S535.txt
- INMS_MS_2016-048_R1032_D010_S536.txt
- INMS_MS_2016-048_R1032_D010_S537.txt
- INMS_MS_2016-048_R1032_D010_S538.txt
- INMS_MS_2016-048_R1032_D010_S539.txt
- INMS_MS_2016-048_R1032_D010_S540.txt
- INMS_MS_2016-048_R1032_D010_S541.txt
- INMS_MS_2016-048_R1032_D010_S542.txt
- INMS_MS_2016-048_R1032_D010_S543.txt
- INMS_MS_2016-048_R1032_D010_S544.txt
- INMS_MS_2016-048_R1032_D010_S545.txt
- INMS_MS_2016-048_R1032_D010_S546.txt
- INMS_MS_2016-048_R1032_D010_S547.txt
- INMS_MS_2016-048_R1032_D010_S548.txt
- INMS_MS_2016-048_R1032_D010_S549.txt
- INMS_MS_2016-048_R1032_D010_S550.txt
- INMS_MS_2016-048_R1032_D010_S551.txt
- INMS_MS_2016-048_R1032_D010_S552.txt
- INMS_MS_2016-048_R1032_D010_S553.txt
- INMS_MS_2016-048_R1032_D010_S554.txt
- INMS_MS_2016-048_R1032_D010_S555.txt
- INMS_MS_2016-048_R1032_D010_S556.txt
- INMS_MS_2016-048_R1032_D010_S557.txt
- INMS_MS_2016-048_R1032_D010_S558.txt
- INMS_MS_2016-048_R1032_D010_S559.txt
- INMS_MS_2016-048_R1032_D010_S560.txt
- INMS_MS_2016-048_R1032_D010_S561.txt
- INMS_MS_2016-048_R1032_D010_S562.txt
- INMS_MS_2016-048_R1032_D011_S563.txt
- INMS_MS_2016-048_R1032_D011_S564.txt
- INMS_MS_2016-048_R1032_D011_S565.txt
- INMS_MS_2016-048_R1032_D011_S566.txt
- INMS_MS_2016-048_R1032_D011_S567.txt
- INMS_MS_2016-048_R1032_D011_S568.txt
- INMS_MS_2016-048_R1032_D011_S569.txt
- INMS_MS_2016-048_R1032_D011_S570.txt
- INMS_MS_2016-048_R1032_D011_S571.txt
- INMS_MS_2016-048_R1032_D011_S572.txt
- INMS_MS_2016-048_R1032_D011_S573.txt
- INMS_MS_2016-048_R1032_D011_S574.txt
- INMS_MS_2016-048_R1032_D011_S575.txt
- INMS_MS_2016-048_R1032_D011_S576.txt
- INMS_MS_2016-048_R1032_D011_S577.txt
- INMS_MS_2016-048_R1032_D011_S578.txt
- INMS_MS_2016-048_R1032_D011_S579.txt
- INMS_MS_2016-048_R1032_D011_S580.txt
- INMS_MS_2016-048_R1032_D011_S581.txt
- INMS_MS_2016-048_R1032_D011_S582.txt
- INMS_MS_2016-048_R1032_D011_S583.txt
- INMS_MS_2016-048_R1032_D011_S584.txt
- INMS_MS_2016-048_R1032_D011_S585.txt
- INMS_MS_2016-048_R1032_D011_S586.txt
- INMS_MS_2016-048_R1032_D011_S587.txt
- INMS_MS_2016-048_R1032_D011_S588.txt
- INMS_MS_2016-048_R1032_D011_S589.txt
- INMS_MS_2016-048_R1032_D011_S590.txt
- INMS_MS_2016-048_R1032_D011_S591.txt
- INMS_MS_2016-048_R1032_D011_S592.txt
- INMS_MS_2016-048_R1032_D011_S593.txt
- INMS_MS_2016-048_R1032_D011_S594.txt
- INMS_MS_2016-048_R1032_D011_S595.txt
- INMS_MS_2016-048_R1032_D011_S596.txt
- INMS_MS_2016-048_R1032_D011_S597.txt
- INMS_MS_2016-048_R1032_D011_S598.txt
- INMS_MS_2016-048_R1032_D011_S599.txt
- INMS_MS_2016-048_R1032_D011_S600.txt
- INMS_MS_2016-048_R1032_D011_S601.txt
- INMS_MS_2016-048_R1032_D011_S602.txt
- INMS_MS_2016-048_R1032_D011_S603.txt
- INMS_MS_2016-048_R1032_D011_S604.txt
- INMS_MS_2016-048_R1032_D011_S605.txt
- INMS_MS_2016-048_R1032_D011_S606.txt
- INMS_MS_2016-048_R1032_D011_S607.txt
- INMS_MS_2016-048_R1032_D011_S608.txt
- INMS_MS_2016-048_R1032_D011_S609.txt
- INMS_MS_2016-048_R1032_D011_S610.txt
- INMS_MS_2016-048_R1032_D011_S611.txt
- INMS_MS_2016-048_R1032_D011_S612.txt
- INMS_MS_2016-048_R1032_D011_S613.txt
- INMS_MS_2016-048_R1032_D011_S614.txt
- INMS_MS_2016-048_R1032_D011_S615.txt
- INMS_MS_2016-048_R1032_D011_S616.txt
- INMS_MS_2016-048_R1032_D011_S617.txt
- INMS_MS_2016-048_R1032_D011_S618.txt
- INMS_MS_2016-048_R1032_D011_S619.txt
- INMS_MS_2016-048_R1032_D011_S620.txt
- INMS_MS_2016-048_R1032_D011_S621.txt
- INMS_MS_2016-048_R1032_D011_S622.txt
- INMS_MS_2016-048_R1032_D011_S623.txt
- INMS_MS_2016-048_R1032_D011_S624.txt
- INMS_MS_2016-048_R1032_D011_S625.txt
- INMS_MS_2016-048_R1032_D011_S626.txt
- INMS_MS_2016-048_R1032_D011_S627.txt
- INMS_MS_2016-048_R1032_D011_S628.txt
- INMS_MS_2016-048_R1032_D011_S629.txt
- INMS_MS_2016-048_R1032_D011_S630.txt
- INMS_MS_2016-048_R1032_D011_S631.txt
- INMS_MS_2016-048_R1032_D011_S632.txt
- INMS_MS_2016-048_R1032_D011_S633.txt
- INMS_MS_2016-048_R1032_D011_S634.txt
- INMS_MS_2016-048_R1032_D011_S635.txt
- INMS_MS_2016-048_R1032_D011_S636.txt
- INMS_MS_2016-048_R1032_D011_S637.txt
- INMS_MS_2016-048_R1032_D011_S638.txt
- INMS_MS_2016-048_R1032_D011_S639.txt
- INMS_MS_2016-048_R1032_D011_S640.txt
- INMS_MS_2016-048_R1032_D011_S641.txt
- INMS_MS_2016-048_R1032_D011_S642.txt
- INMS_MS_2016-048_R1032_D012_S643.txt
- INMS_MS_2016-048_R1032_D012_S644.txt
- INMS_MS_2016-048_R1032_D012_S645.txt
- INMS_MS_2016-048_R1032_D012_S646.txt
- INMS_MS_2016-048_R1032_D012_S647.txt
- INMS_MS_2016-048_R1032_D012_S648.txt
- INMS_MS_2016-048_R1032_D012_S649.txt
- INMS_MS_2016-048_R1032_D012_S650.txt
- INMS_MS_2016-048_R1032_D012_S651.txt
- INMS_MS_2016-048_R1032_D012_S652.txt
- INMS_MS_2016-048_R1032_D012_S653.txt
- INMS_MS_2016-048_R1032_D012_S654.txt
- INMS_MS_2016-048_R1032_D012_S655.txt
- INMS_MS_2016-048_R1032_D012_S656.txt
- INMS_MS_2016-048_R1032_D012_S657.txt
- INMS_MS_2016-048_R1032_D012_S658.txt
- INMS_MS_2016-048_R1032_D012_S659.txt
- INMS_MS_2016-048_R1032_D012_S660.txt
- INMS_MS_2016-048_R1032_D012_S661.txt
- INMS_MS_2016-048_R1032_D012_S662.txt
- INMS_MS_2016-048_R1032_D012_S663.txt
- INMS_MS_2016-048_R1032_D012_S664.txt
- INMS_MS_2016-048_R1032_D012_S665.txt
- INMS_MS_2016-048_R1032_D012_S666.txt
- INMS_MS_2016-048_R1032_D012_S667.txt
- INMS_MS_2016-048_R1032_D012_S668.txt
- INMS_MS_2016-048_R1032_D012_S669.txt
- INMS_MS_2016-048_R1032_D012_S670.txt
- INMS_MS_2016-048_R1032_D012_S671.txt
- INMS_MS_2016-048_R1032_D012_S672.txt
- INMS_MS_2016-048_R1032_D012_S673.txt
- INMS_MS_2016-048_R1032_D012_S674.txt
- INMS_MS_2016-048_R1032_D012_S675.txt
- INMS_MS_2016-048_R1032_D012_S676.txt
- INMS_MS_2016-048_R1032_D012_S677.txt
- INMS_MS_2016-048_R1032_D012_S678.txt
- INMS_MS_2016-048_R1032_D012_S679.txt
- INMS_MS_2016-048_R1032_D012_S680.txt
- INMS_MS_2016-048_R1032_D012_S681.txt
- INMS_MS_2016-048_R1032_D012_S682.txt
- INMS_MS_2016-048_R1032_D012_S683.txt
- INMS_MS_2016-048_R1032_D012_S684.txt
- INMS_MS_2016-048_R1032_D012_S685.txt
- INMS_MS_2016-048_R1032_D012_S686.txt
- INMS_MS_2016-048_R1032_D012_S687.txt
- INMS_MS_2016-048_R1032_D012_S688.txt
- INMS_MS_2016-048_R1032_D012_S689.txt
- INMS_MS_2016-048_R1032_D012_S690.txt
- INMS_MS_2016-048_R1032_D012_S691.txt
- INMS_MS_2016-048_R1032_D012_S692.txt
- INMS_MS_2016-048_R1032_D012_S693.txt
- INMS_MS_2016-048_R1032_D012_S694.txt
- INMS_MS_2016-048_R1032_D012_S695.txt
- INMS_MS_2016-048_R1032_D012_S696.txt
- INMS_MS_2016-048_R1032_D012_S697.txt
- INMS_MS_2016-048_R1032_D012_S698.txt
- INMS_MS_2016-048_R1032_D012_S699.txt
- INMS_MS_2016-048_R1032_D012_S700.txt
- INMS_MS_2016-048_R1032_D012_S701.txt
- INMS_MS_2016-048_R1032_D012_S702.txt
- INMS_MS_2016-048_R1032_D012_S703.txt
- INMS_MS_2016-048_R1032_D012_S704.txt
- INMS_MS_2016-048_R1032_D012_S705.txt
- INMS_MS_2016-048_R1032_D012_S706.txt
- INMS_MS_2016-048_R1032_D012_S707.txt
- INMS_MS_2016-048_R1032_D012_S708.txt
- INMS_MS_2016-048_R1032_D012_S709.txt
- INMS_MS_2016-048_R1032_D012_S710.txt
- INMS_MS_2016-048_R1032_D012_S711.txt
- INMS_MS_2016-048_R1032_D012_S712.txt
- INMS_MS_2016-048_R1032_D012_S713.txt
- INMS_MS_2016-048_R1032_D012_S714.txt
- INMS_MS_2016-048_R1032_D012_S715.txt
- INMS_MS_2016-048_R1032_D012_S716.txt
- INMS_MS_2016-048_R1032_D012_S717.txt
- INMS_MS_2016-048_R1032_D012_S718.txt
- INMS_MS_2016-048_R1032_D012_S719.txt
- INMS_MS_2016-048_R1032_D012_S720.txt
- INMS_MS_2016-048_R1032_D012_S721.txt
- INMS_MS_2016-048_R1032_D012_S722.txt
- INMS_MS_2016-048_R1032_D013_S723.txt
- INMS_MS_2016-048_R1032_D013_S724.txt
- INMS_MS_2016-048_R1032_D013_S725.txt
- INMS_MS_2016-048_R1032_D013_S726.txt
- INMS_MS_2016-048_R1032_D013_S727.txt
- INMS_MS_2016-048_R1032_D013_S728.txt
- INMS_MS_2016-048_R1032_D013_S729.txt
- INMS_MS_2016-048_R1032_D013_S730.txt
- INMS_MS_2016-048_R1032_D013_S731.txt
- INMS_MS_2016-048_R1032_D013_S732.txt
- INMS_MS_2016-048_R1032_D013_S733.txt
- INMS_MS_2016-048_R1032_D013_S734.txt
- INMS_MS_2016-048_R1032_D013_S735.txt
- INMS_MS_2016-048_R1032_D013_S736.txt
- INMS_MS_2016-048_R1032_D013_S737.txt
- INMS_MS_2016-048_R1032_D013_S738.txt
- INMS_MS_2016-048_R1032_D013_S739.txt
- INMS_MS_2016-048_R1032_D013_S740.txt
- INMS_MS_2016-048_R1032_D013_S741.txt
- INMS_MS_2016-048_R1032_D013_S742.txt
- INMS_MS_2016-048_R1032_D013_S743.txt
- INMS_MS_2016-048_R1032_D013_S744.txt
- INMS_MS_2016-048_R1032_D013_S745.txt
- INMS_MS_2016-048_R1032_D013_S746.txt
- INMS_MS_2016-048_R1032_D013_S747.txt
- INMS_MS_2016-048_R1032_D013_S748.txt
- INMS_MS_2016-048_R1032_D013_S749.txt
- INMS_MS_2016-048_R1032_D013_S750.txt
- INMS_MS_2016-048_R1032_D013_S751.txt
- INMS_MS_2016-048_R1032_D013_S752.txt
- INMS_MS_2016-048_R1032_D013_S753.txt
- INMS_MS_2016-048_R1032_D013_S754.txt
- INMS_MS_2016-048_R1032_D013_S755.txt
- INMS_MS_2016-048_R1032_D013_S756.txt
- INMS_MS_2016-048_R1032_D013_S757.txt
- INMS_MS_2016-048_R1032_D013_S758.txt
- INMS_MS_2016-048_R1032_D013_S759.txt
- INMS_MS_2016-048_R1032_D013_S760.txt
- INMS_MS_2016-048_R1032_D013_S761.txt
- INMS_MS_2016-048_R1032_D013_S762.txt
- INMS_MS_2016-048_R1032_D013_S763.txt
- INMS_MS_2016-048_R1032_D013_S764.txt
- INMS_MS_2016-048_R1032_D013_S765.txt
- INMS_MS_2016-048_R1032_D013_S766.txt
- INMS_MS_2016-048_R1032_D013_S767.txt
- INMS_MS_2016-048_R1032_D013_S768.txt
- INMS_MS_2016-048_R1032_D013_S769.txt
- INMS_MS_2016-048_R1032_D013_S770.txt
- INMS_MS_2016-048_R1032_D013_S771.txt
- INMS_MS_2016-048_R1032_D013_S772.txt
- INMS_MS_2016-048_R1032_D013_S773.txt
- INMS_MS_2016-048_R1032_D013_S774.txt
- INMS_MS_2016-048_R1032_D013_S775.txt
- INMS_MS_2016-048_R1032_D013_S776.txt
- INMS_MS_2016-048_R1032_D013_S777.txt
- INMS_MS_2016-048_R1032_D013_S778.txt
- INMS_MS_2016-048_R1032_D013_S779.txt
- INMS_MS_2016-048_R1032_D013_S780.txt
- INMS_MS_2016-048_R1032_D013_S781.txt
- INMS_MS_2016-048_R1032_D013_S782.txt
- INMS_MS_2016-048_R1032_D013_S783.txt
- INMS_MS_2016-048_R1032_D013_S784.txt
- INMS_MS_2016-048_R1032_D013_S785.txt
- INMS_MS_2016-048_R1032_D013_S786.txt
- INMS_MS_2016-048_R1032_D013_S787.txt
- INMS_MS_2016-048_R1032_D013_S788.txt
- INMS_MS_2016-048_R1032_D013_S789.txt
- INMS_MS_2016-048_R1032_D013_S790.txt
- INMS_MS_2016-048_R1032_D013_S791.txt
- INMS_MS_2016-048_R1032_D013_S792.txt
- INMS_MS_2016-048_R1032_D013_S793.txt
- INMS_MS_2016-048_R1032_D013_S794.txt
- INMS_MS_2016-048_R1032_D013_S795.txt
- INMS_MS_2016-048_R1032_D013_S796.txt
- INMS_MS_2016-048_R1032_D013_S797.txt
- INMS_MS_2016-048_R1032_D013_S798.txt
- INMS_MS_2016-048_R1032_D013_S799.txt
- INMS_MS_2016-048_R1032_D013_S800.txt
- INMS_MS_2016-048_R1032_D013_S801.txt
- INMS_MS_2016-048_R1032_D013_S802.txt
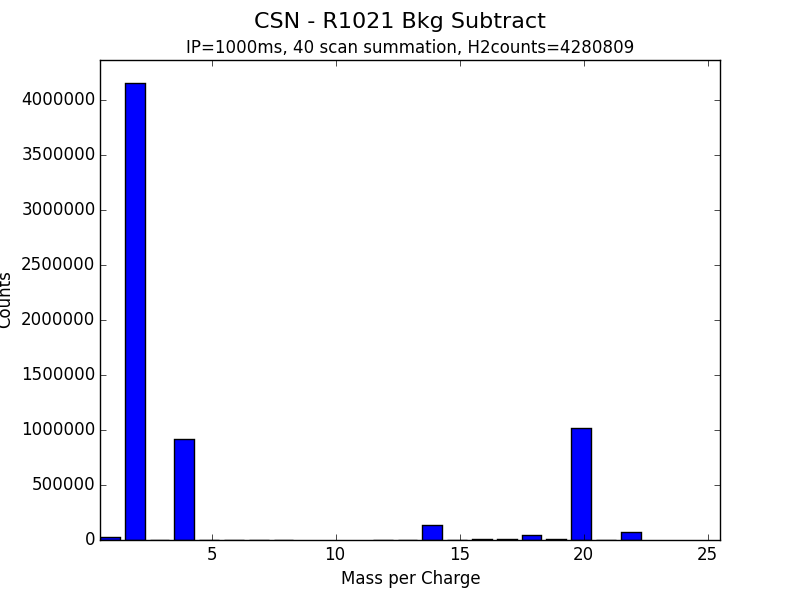
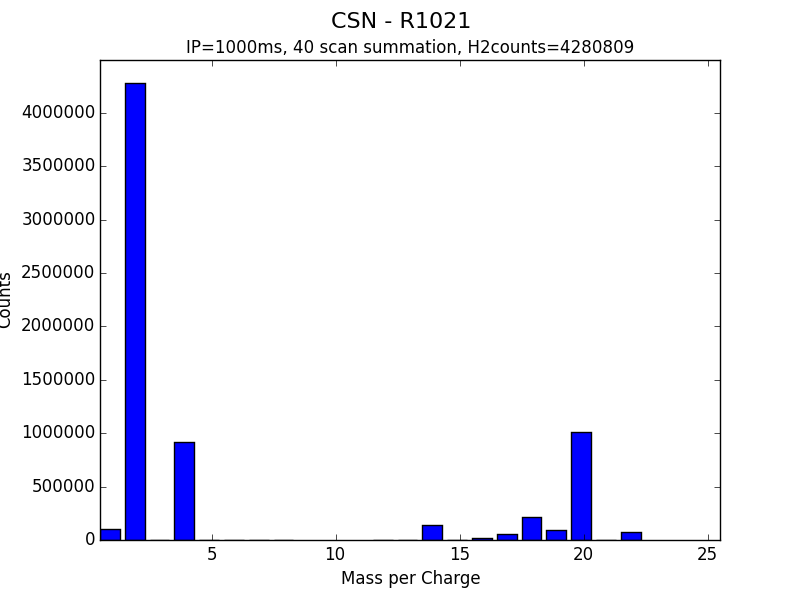
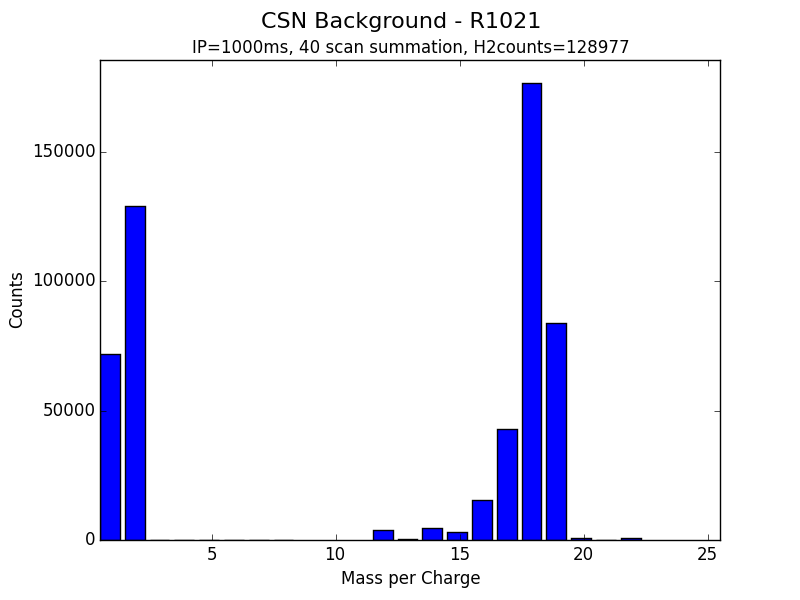
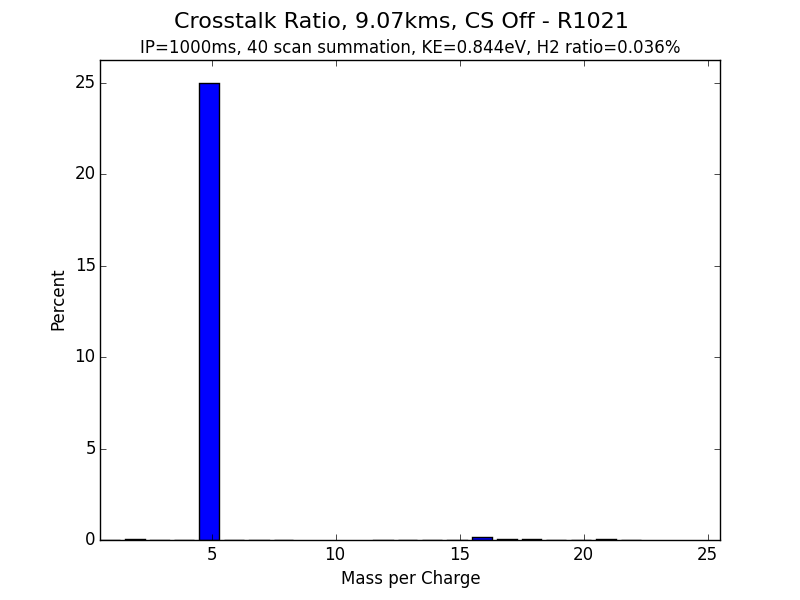
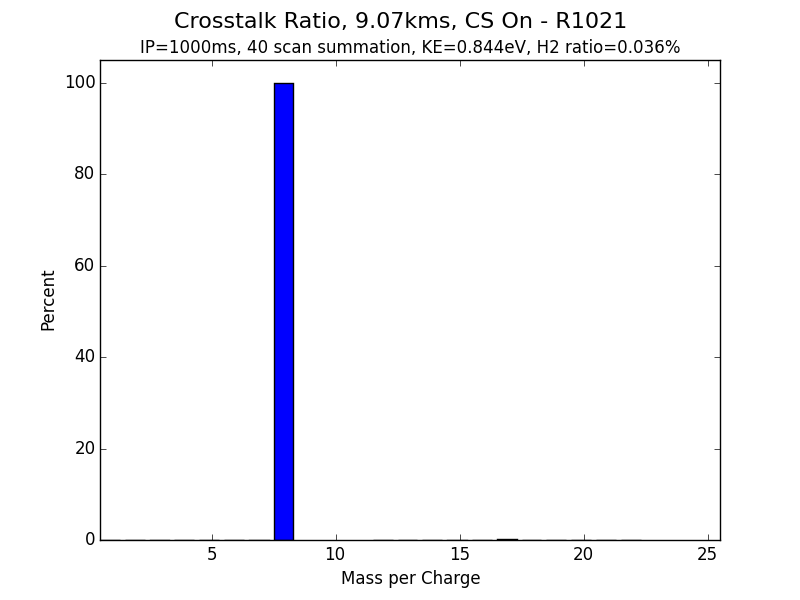
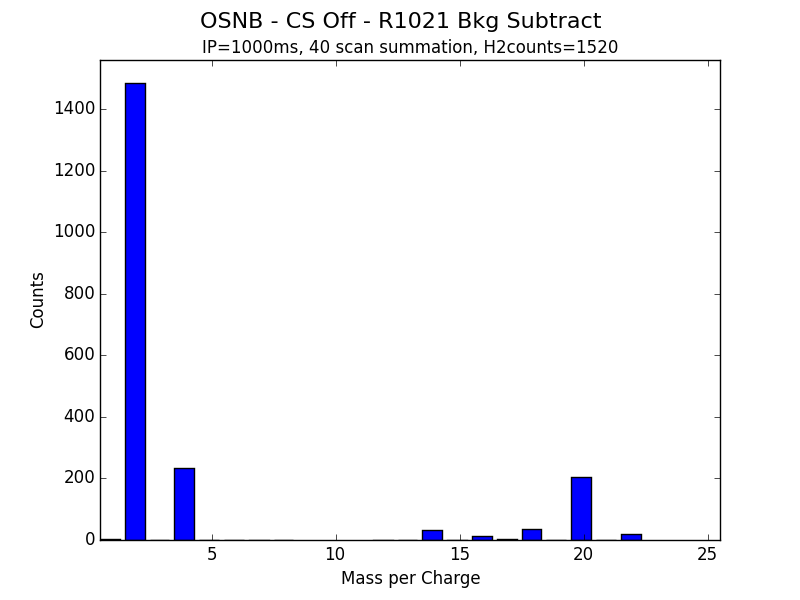


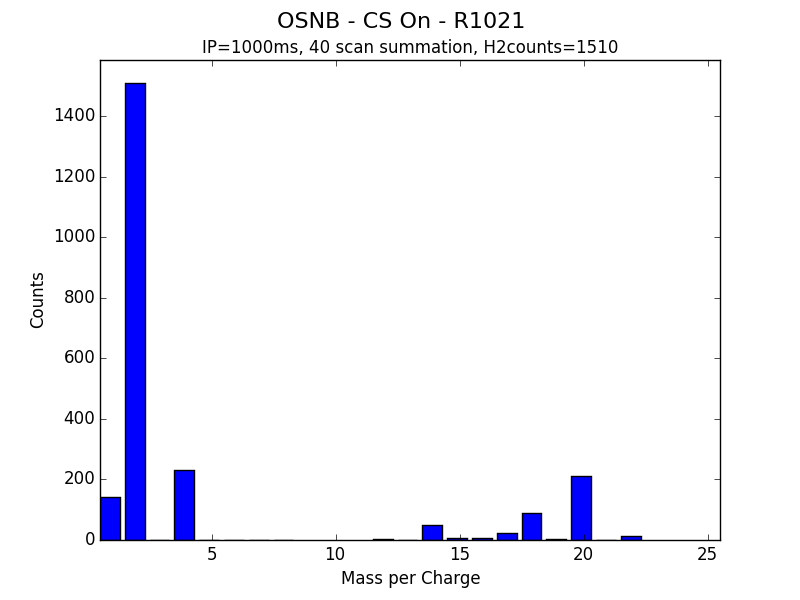
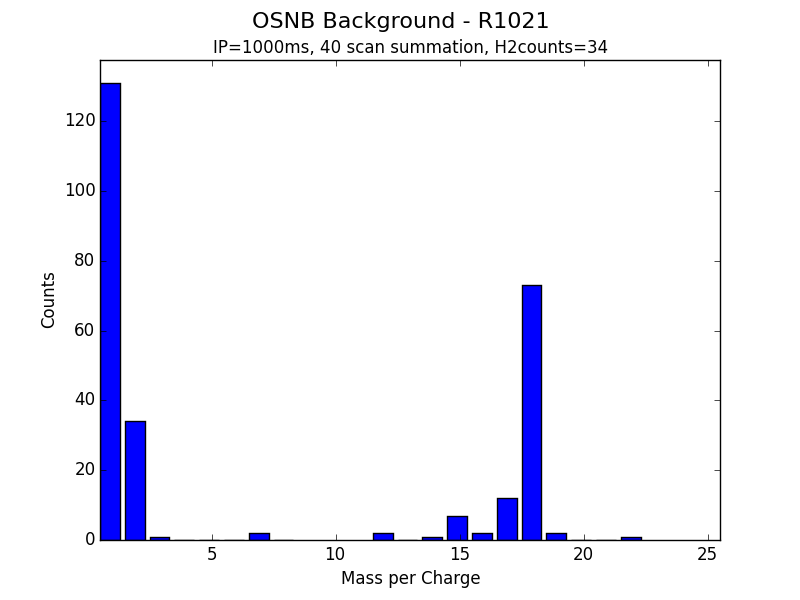
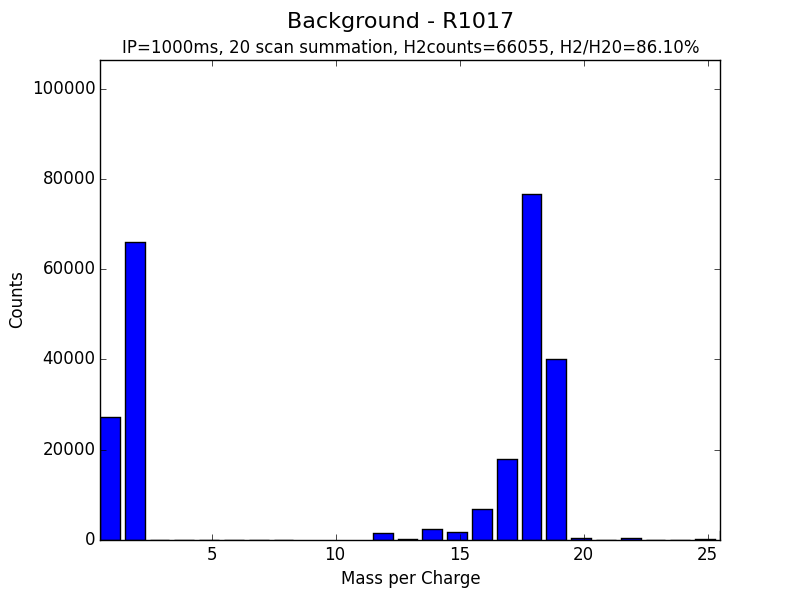
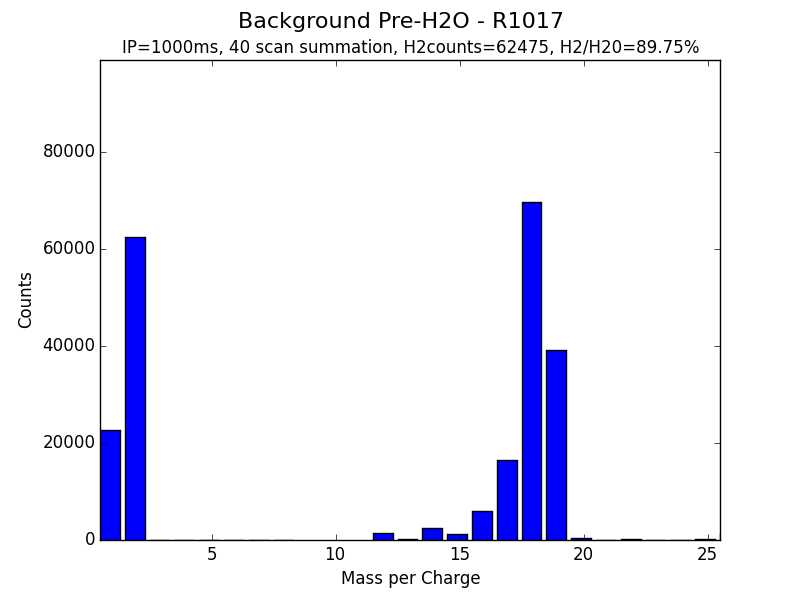
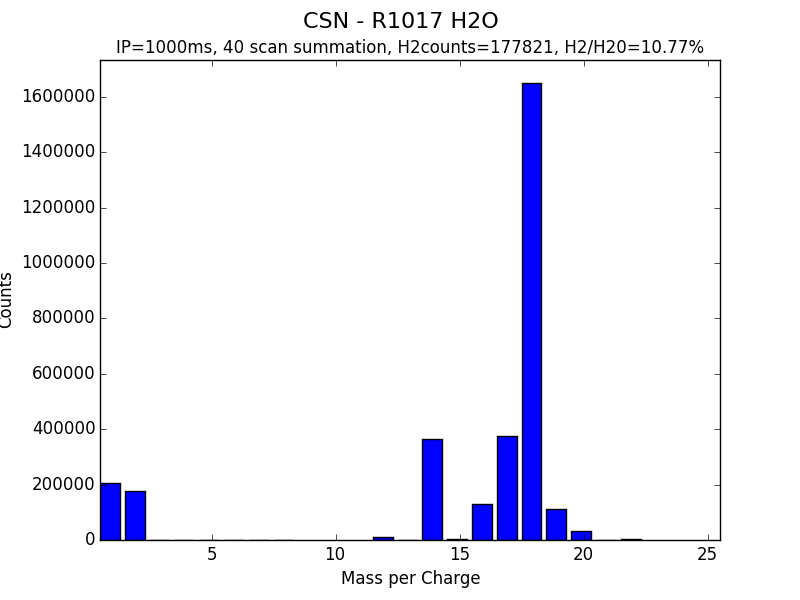
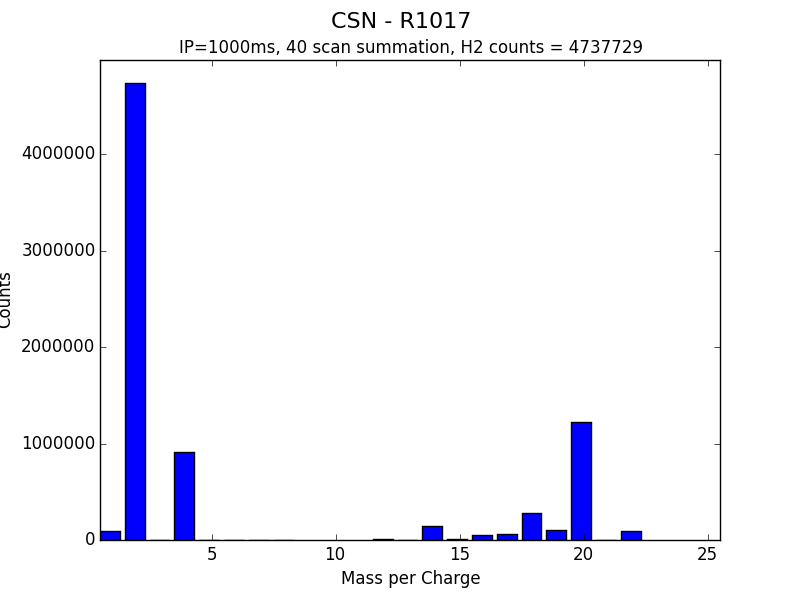
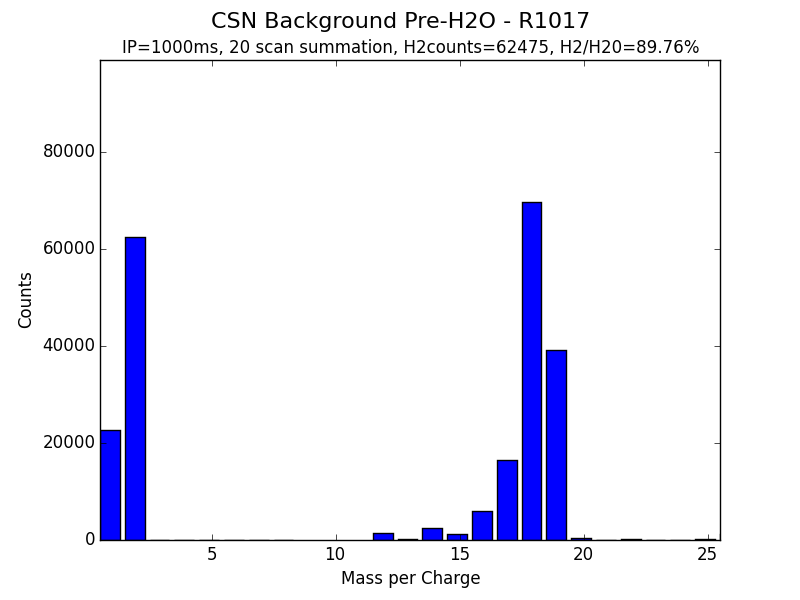
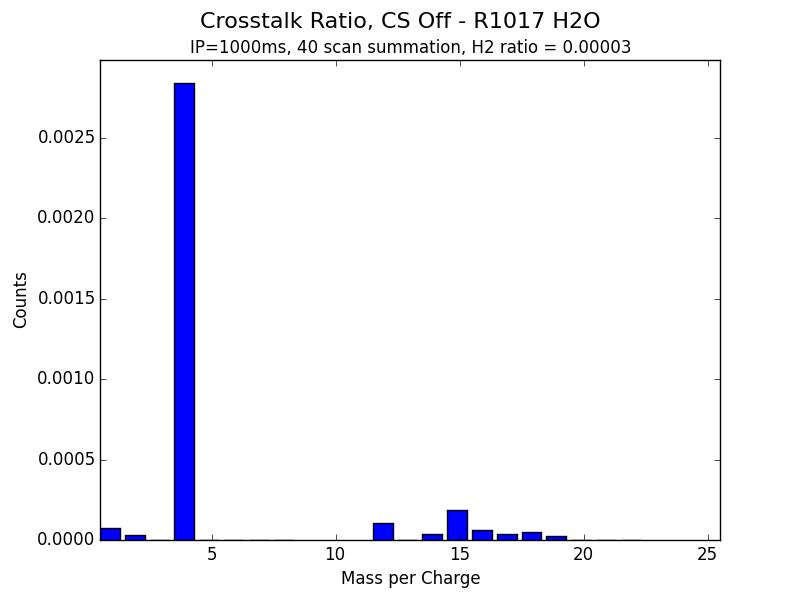
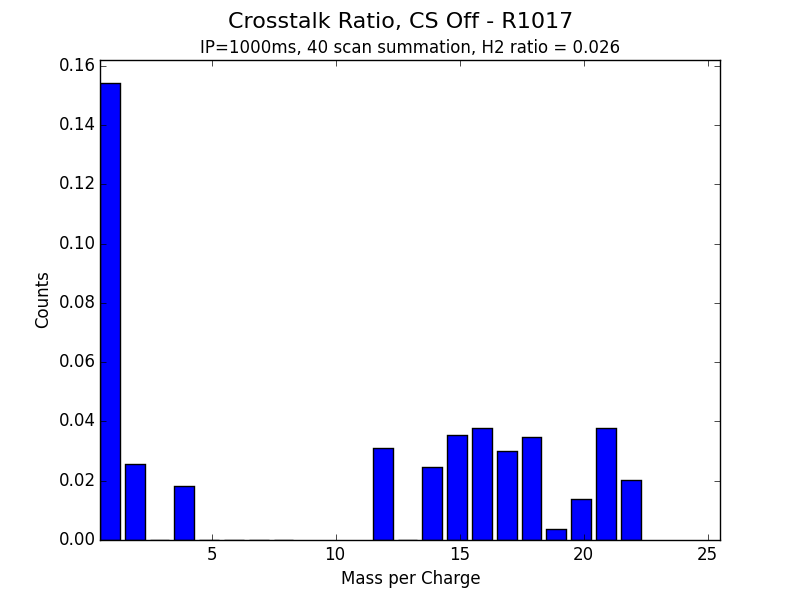
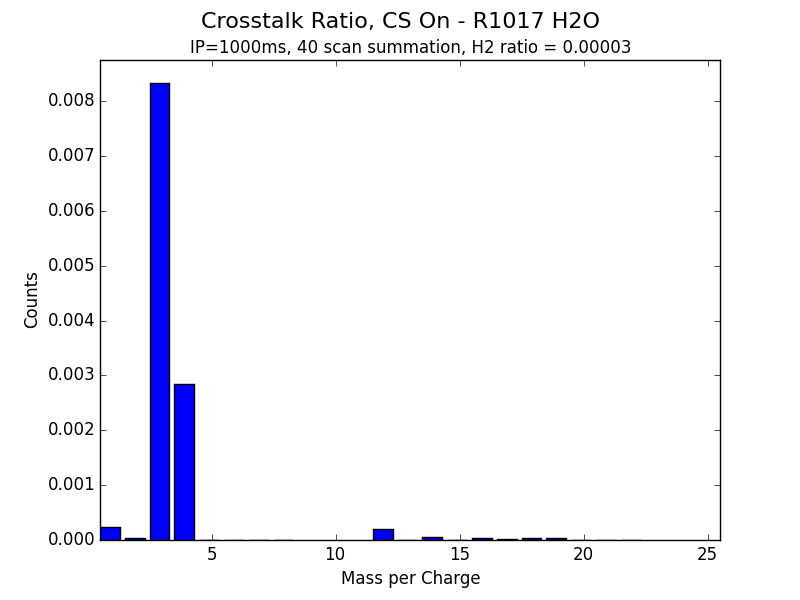
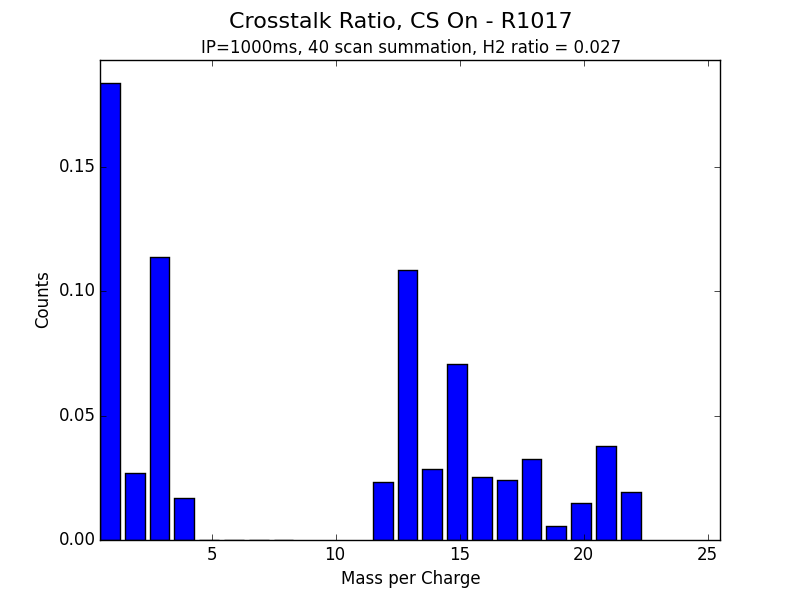

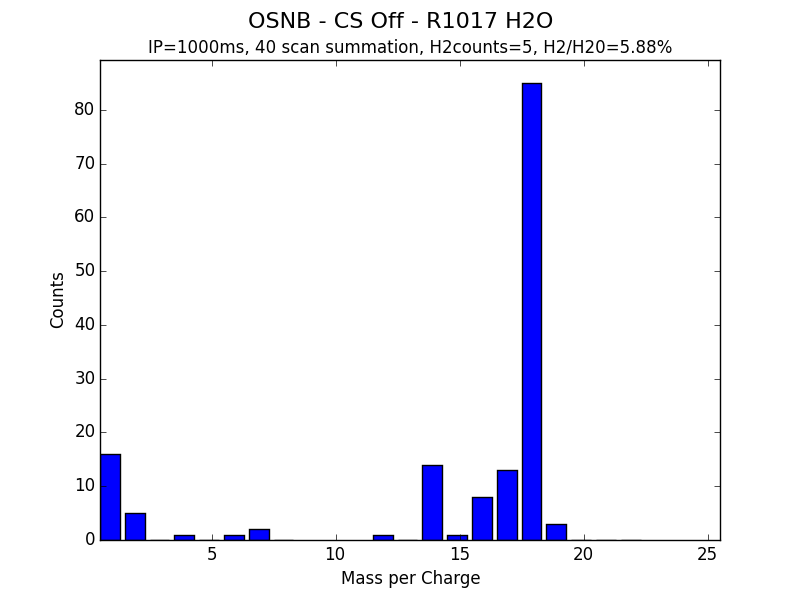
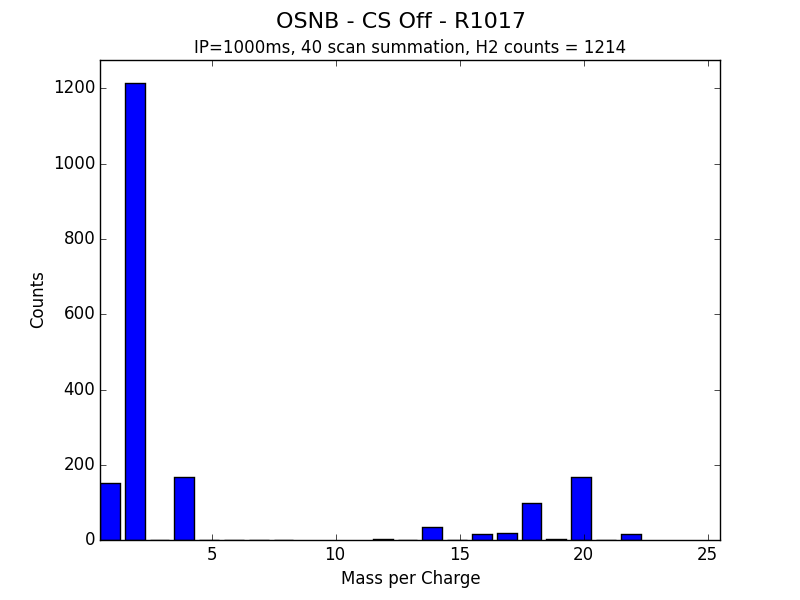
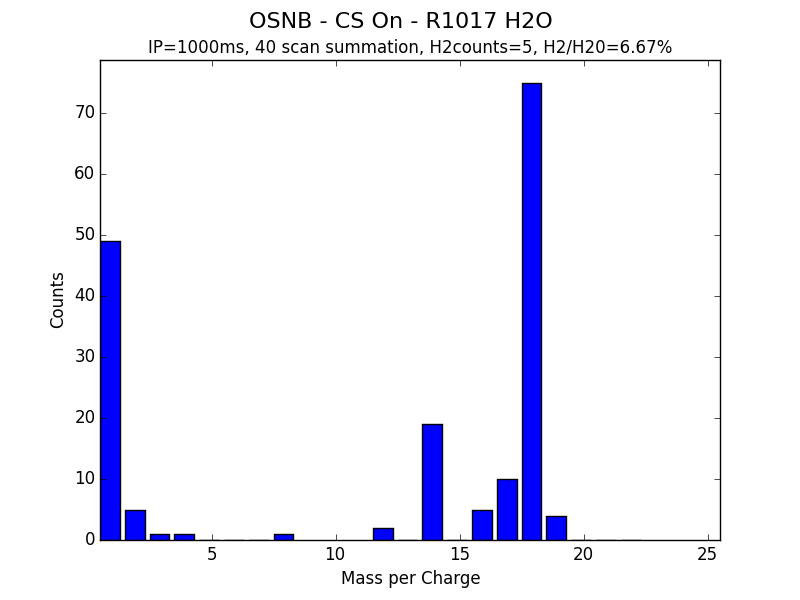
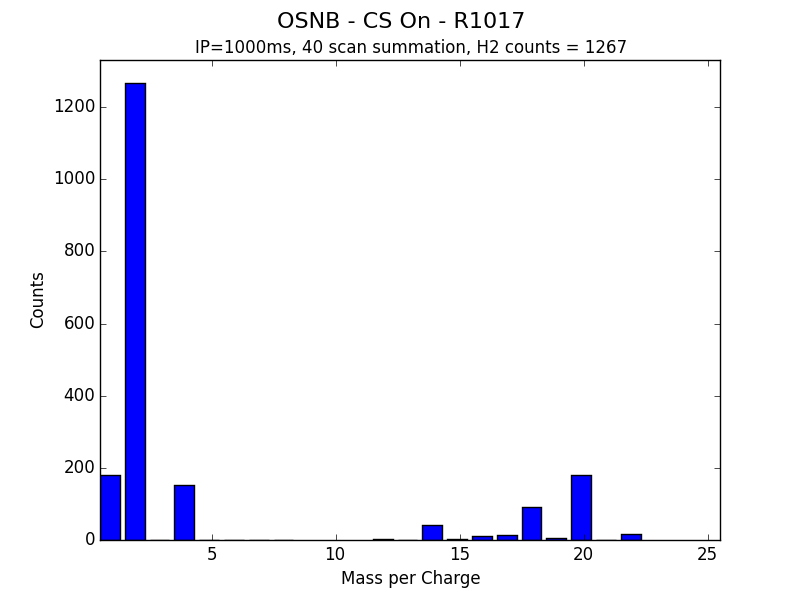
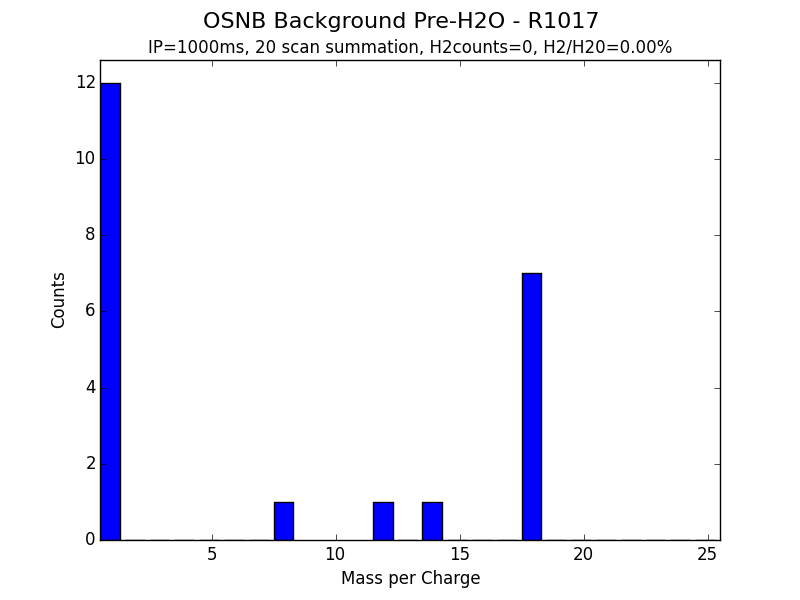

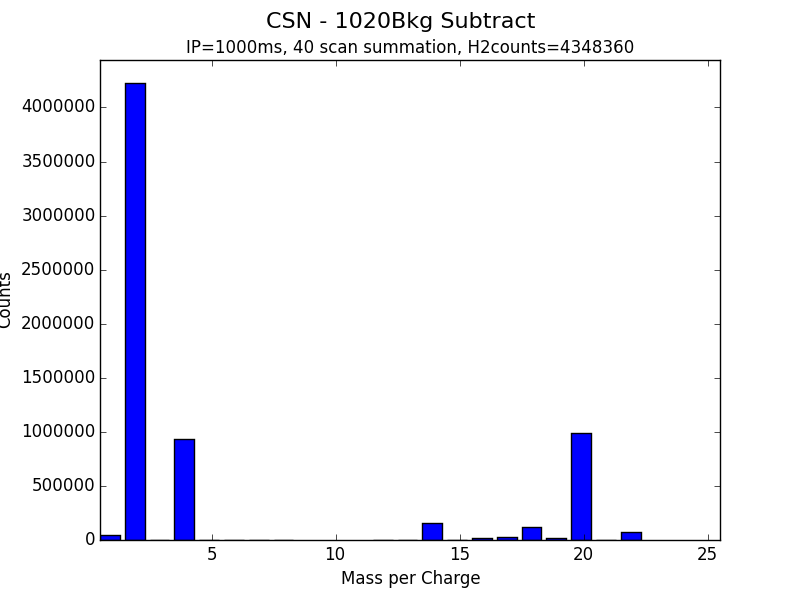

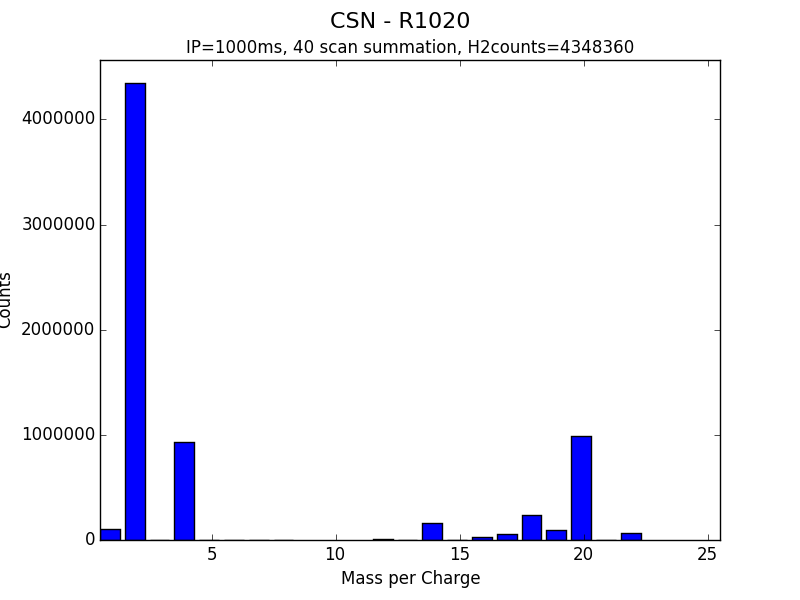
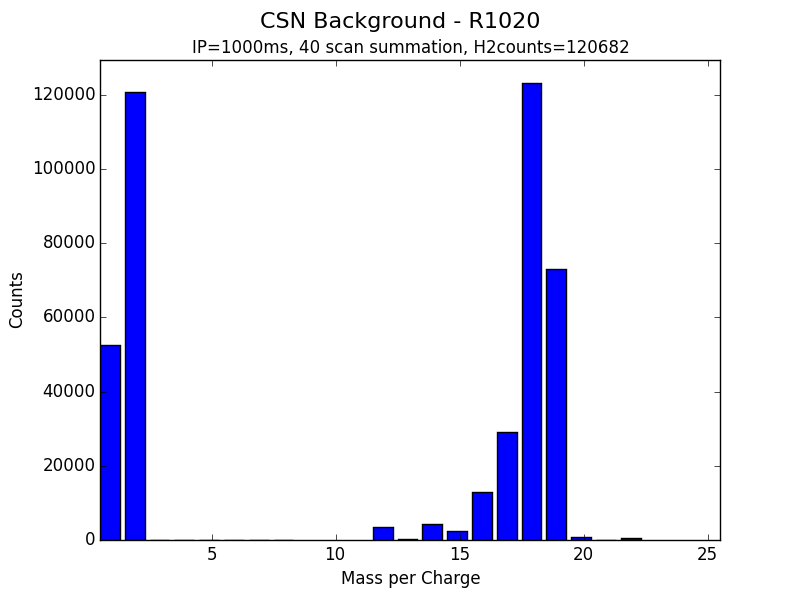

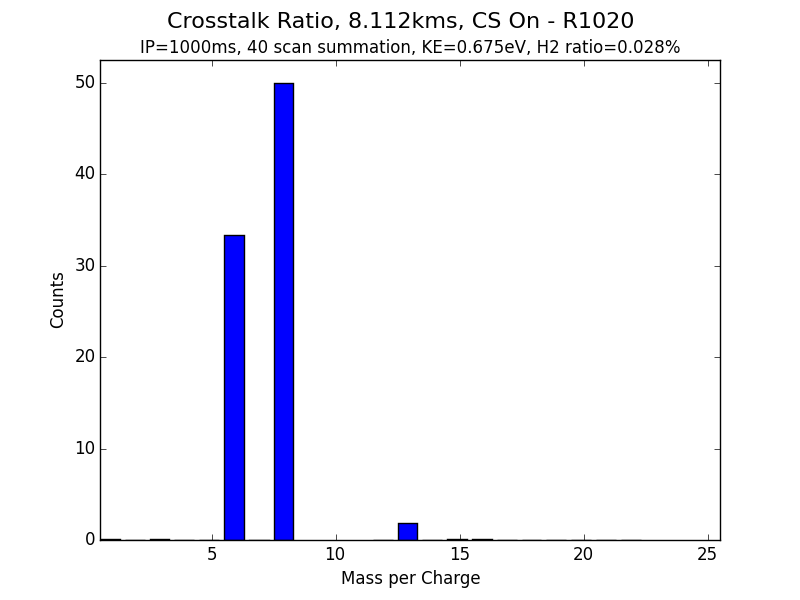

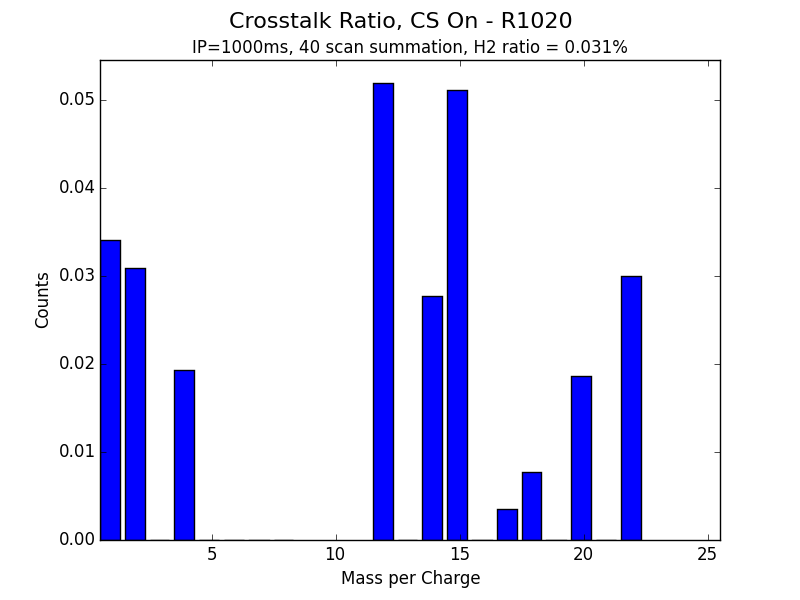
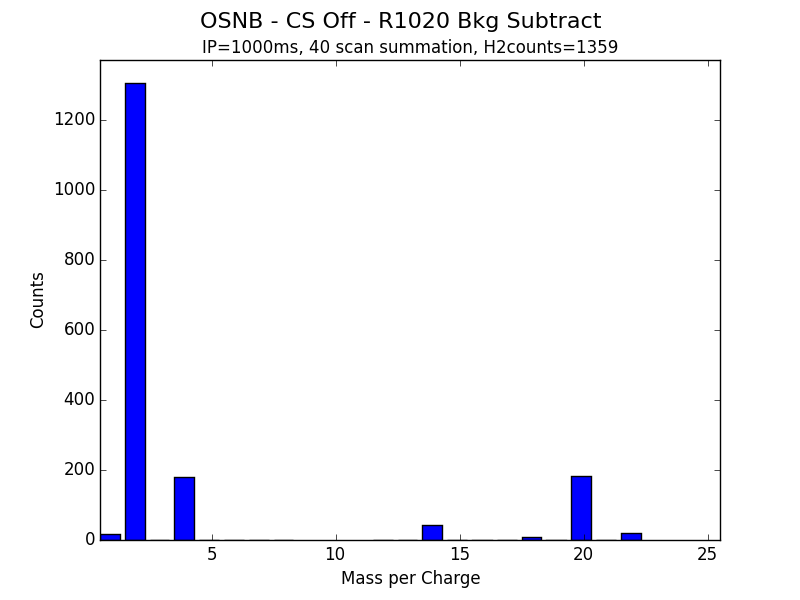

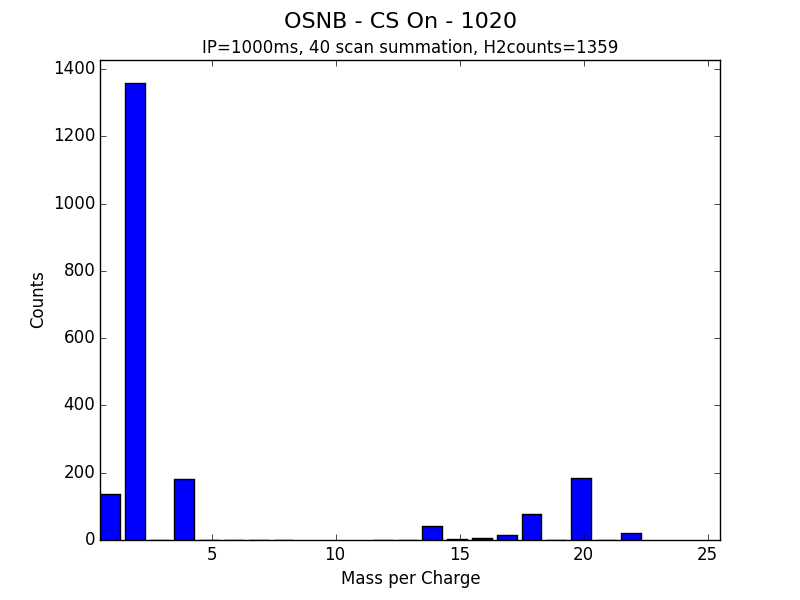

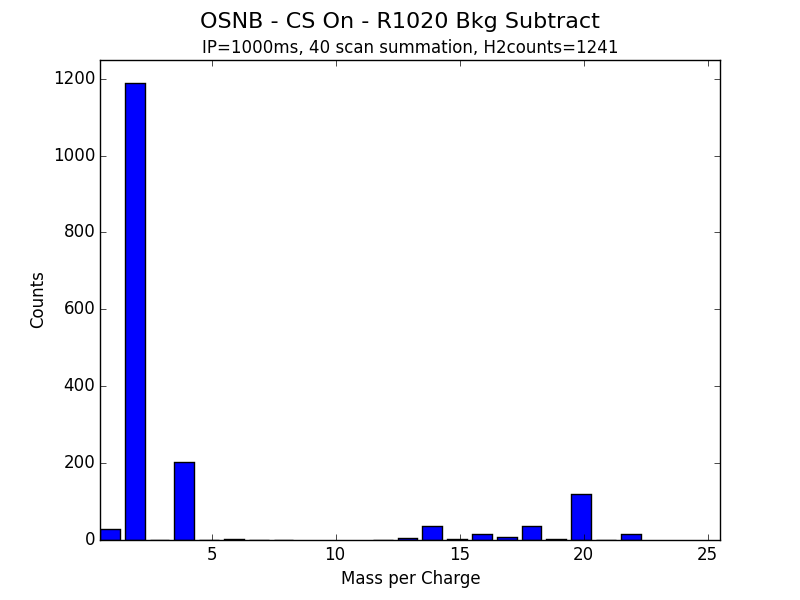
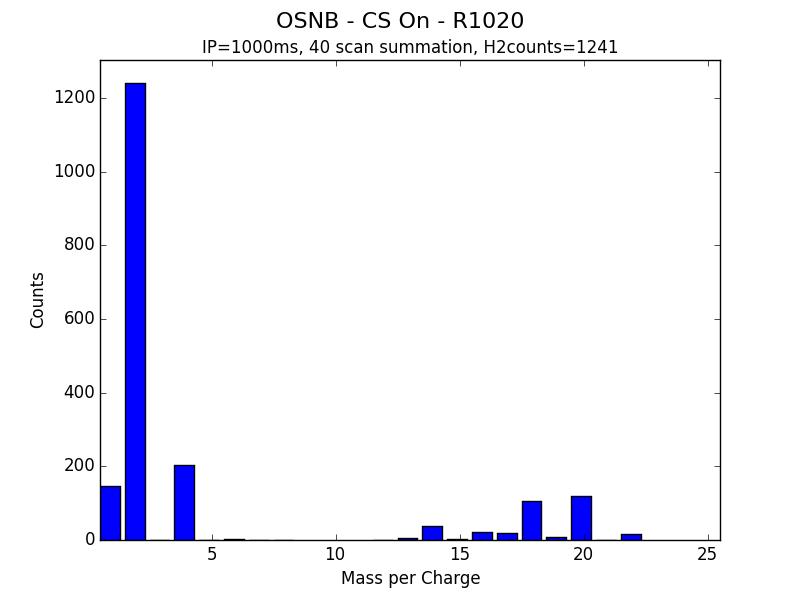
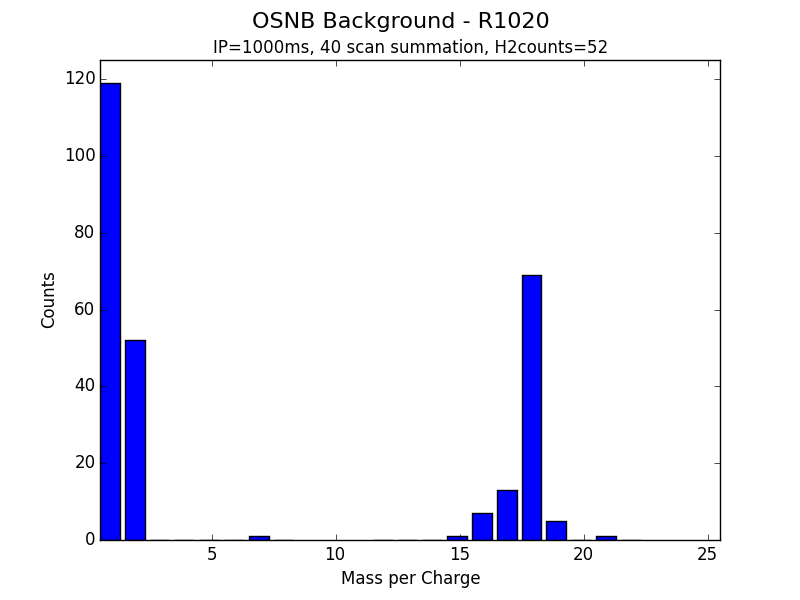
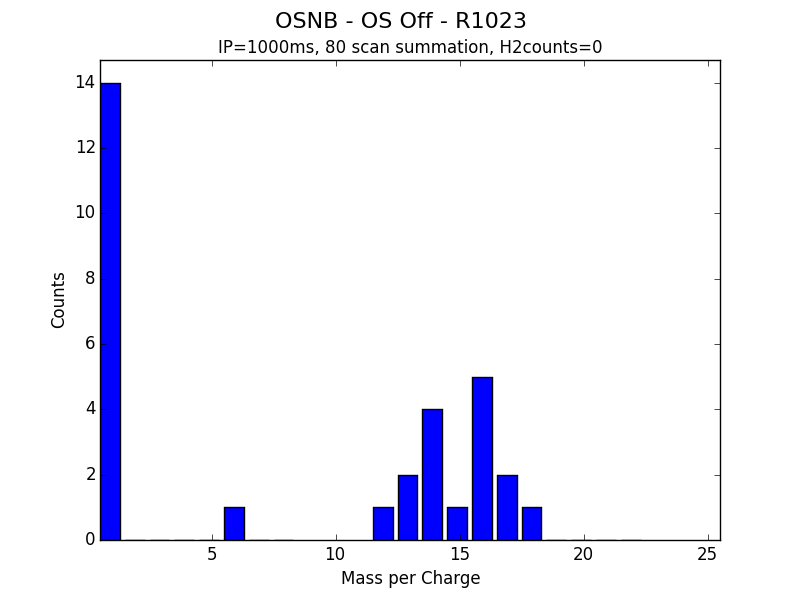


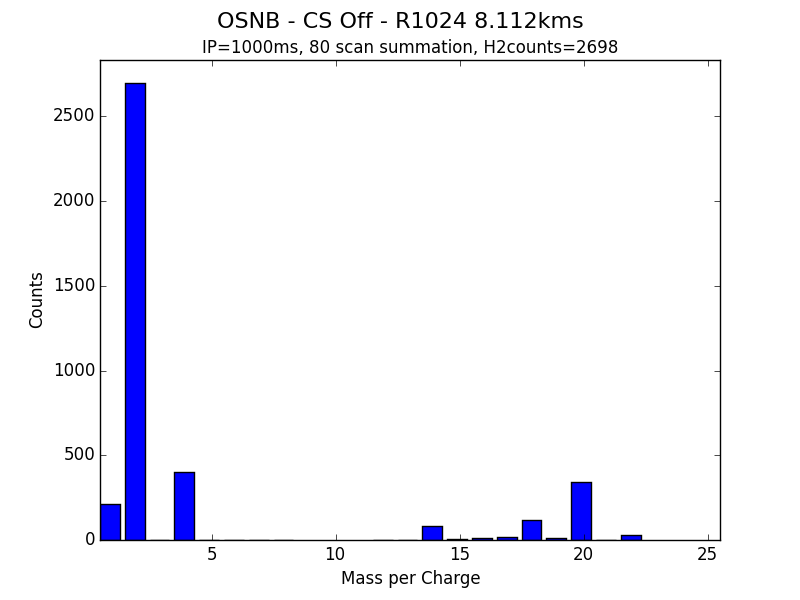
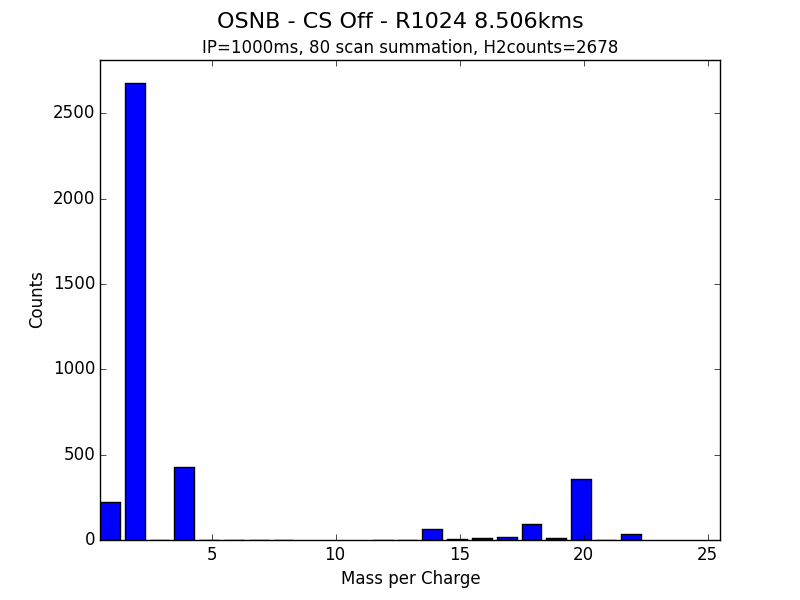
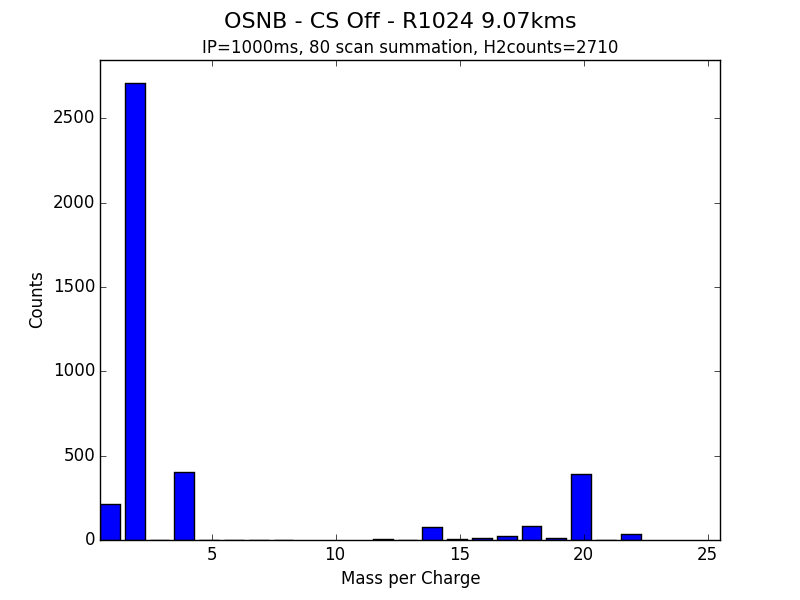
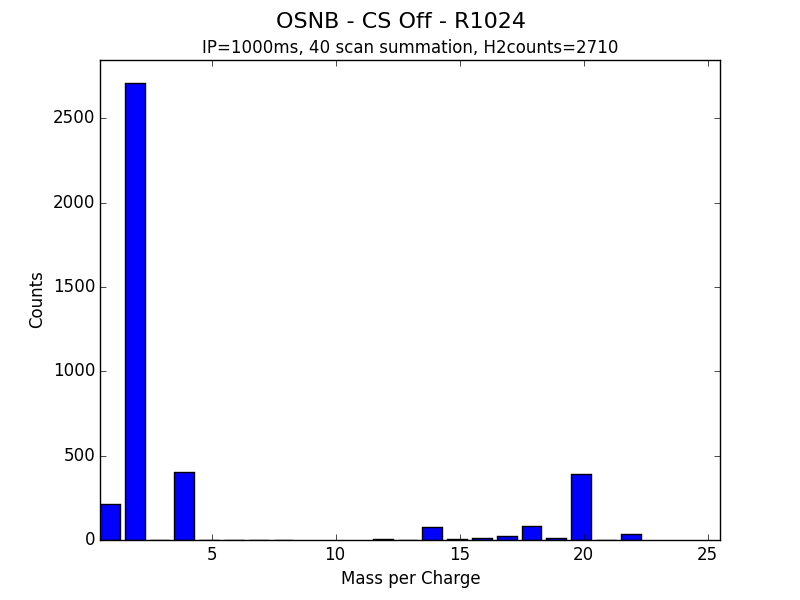
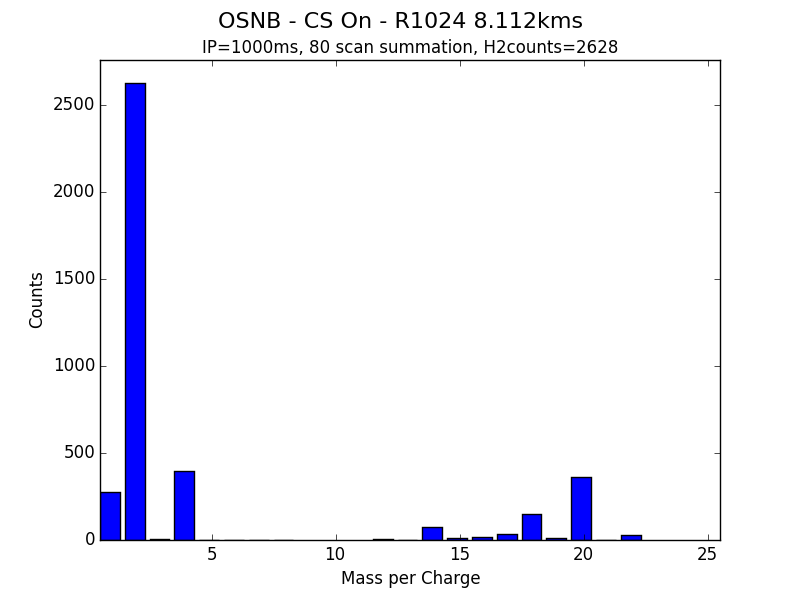
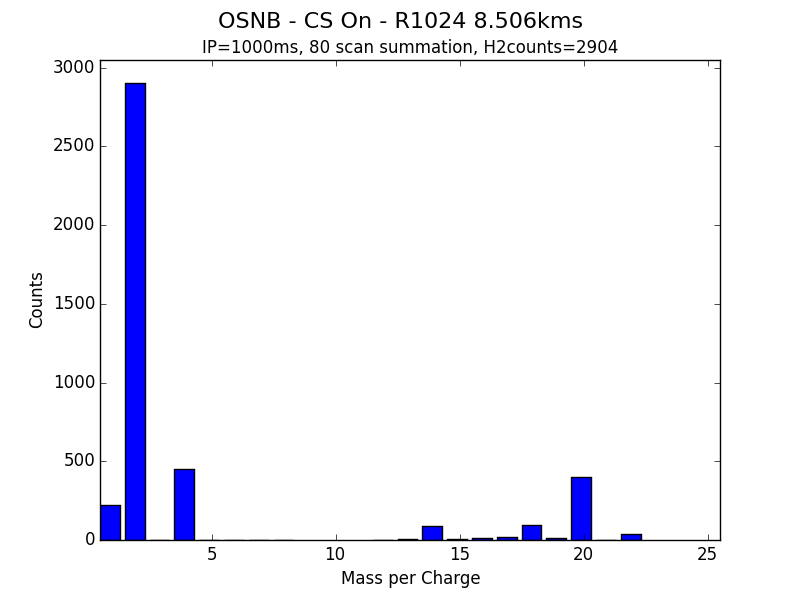
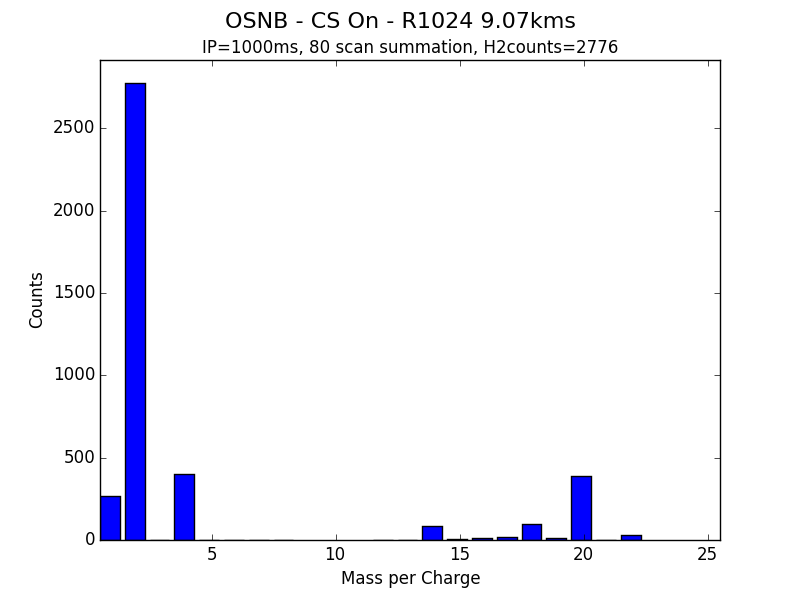
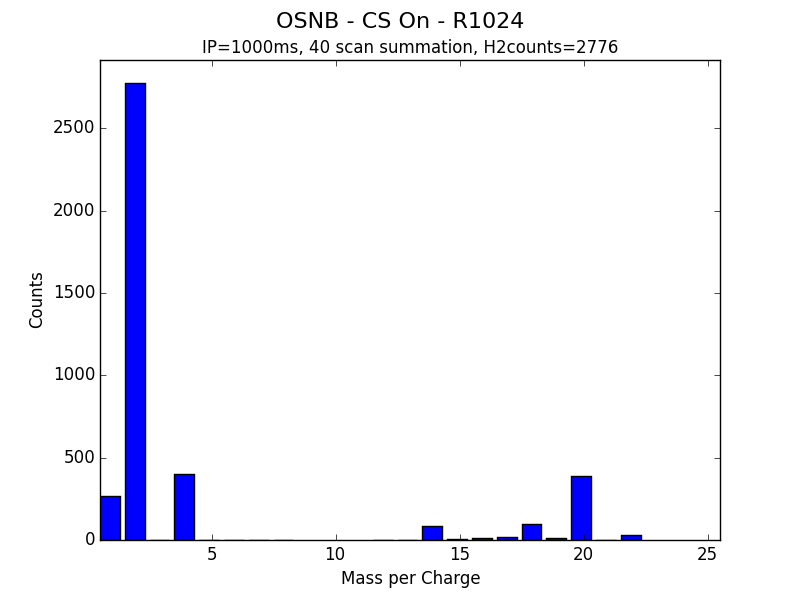

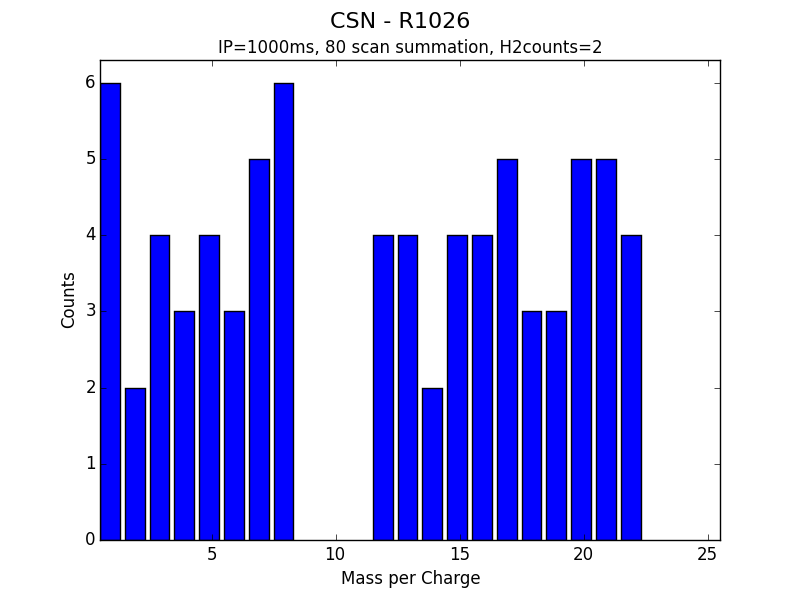
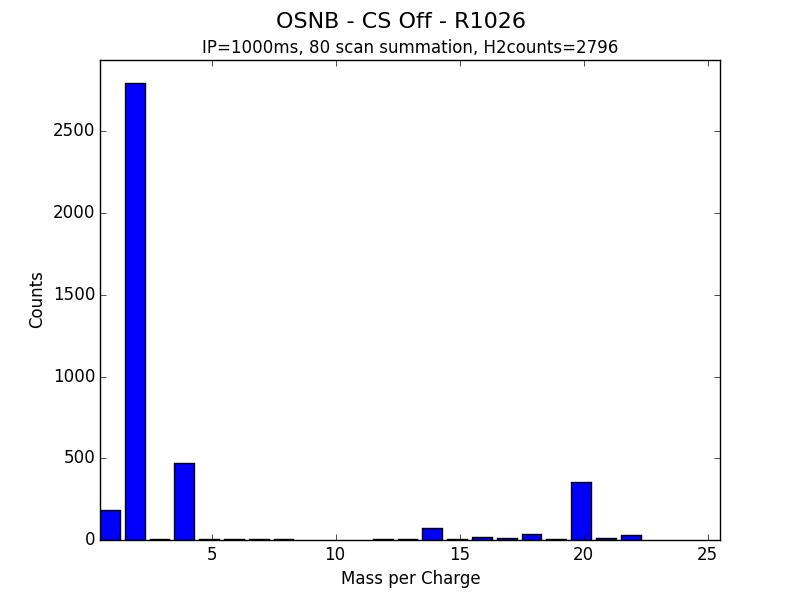

INMS_DA_scratch.py
figure()
sttl = 'Background - R1017'
cts = msc349bkg
ttl = 'IP=1000ms, 20 scan summation, H2counts={:.0f}, H2/H20={:.2f}%'
ttl = ttl.format(cts[1], (cts[1]/cts[14])*100)
plot_MS_bar(massBkg, cts, sttl, ttl)

#==========Generating cross talk plots from data====================#

#specific case for 2015-349 containing data for both H2 and water
#the script did not terminate D003 correctly
#raw D003 contains H2 OSNB CS-off, H2O bkgc, H2O bkgo, H2O OSNB CS-On
ds349 = get_datasets(sorted(msd349.keys()))
ds349['D003']['srange'] = (101, 140)
ds349['D000bkgc'] = ds349.pop('D000')
_ = ds349.pop('D004')
_ = ds349.pop('D005')

ds349h2o = {'D000bkgc': {'srange': (151, 170)},
            'D000bkgo': {'srange': (171, 190)},
            'D003': {'srange': (196, 235)},
            'D004': {'srange': (236, 275)},
            'D005': {'srange': (276, 315)}}

#ds349 uses the same OSNB background dataset as ds349h2o
ds349['D000bkgo']['sum'] = ds349h2o['D000bkgo'].copy()

#include 'H2O' in the ds349h2o sttl
for k in ds349h2o.keys():
    ds349h2o[k]['sttl'] = ds349h2o[k]['sttl']+' H2O'
    print ds349h2o[k]['sttl']

#the background scans in ds349 are masses 1-50 -> truncate to 1-23
dst = ds349
for k in dst.keys():
    if len(dst[k]['masses']) > 19:
        dst[k]['masses'] = masses
        dst[k]['sum'] = dst[k]['sum'][:19]

#the background scans in ds349h2o are masses 1-50 -> truncate to 1-23
dst = ds349h2o
for k in dst.keys():
    if len(dst[k]['masses']) > 19:
        dst[k]['masses'] = masses
        dst[k]['sum'] = dst[k]['sum'][:19]


#specific case for ds356
ds356['D004']['srange'] = (121, 145)
ds356['D001bkgc'] = ds356.pop('D001')
ds356['D002bkgo'] = ds356.pop('D002')

#specific case for ds015
ds015['D003']['sttl'] = 'OSNB - OS Off - R1023'
ds015['D001bkgc'] = ds015.pop('D001')
ds015['D002bkgo'] = ds015.pop('D002')

#specific case for ds018
ds018['D001bkgc'] = ds018.pop('D001')
ds018['D002bkgo'] = ds018.pop('D002')

#specific case for ds027
ds027['D001bkgc'] = ds027.pop('D001')
ds027['D002bkgo'] = ds027.pop('D002')

#specific case for ds028
_ = ds028.pop('D000')
ds028['D001bkgc'] = ds028.pop('D001')
ds028['D002bkgo'] = ds028.pop('D002')

#special case for ds046
#some of the scans in D000 occur between D002 and D003.
#Therefore need to sort on integer value of scan number
msc046.sort(key=lambda ms: int(ms[2]))
_ = ds046.pop('D000')
ds046['D001bkgc'] = ds046.pop('D001')
ds046['D002bkgo'] = ds046.pop('D002')

#specific case for ds047
#Observed evolution of outgassing products as filament warms up
#R1031-D003was moved to 2016-047 directory from 2016-048
#plot evolution of mass species

#specific case for ds048
#must be sorted similar to ds046
msc048.sort(key=lambda ms: int(ms[2]))
_ = ds048.pop('D000')
ds048['D004bkgc'] = ds048.pop('D004')
ds048['D005bkgo'] = ds048.pop('D005')


#specific case for 2015-352
dsets = get_datasets(msf)
msc352 = get_INMS_scan_data(msd352, id0='mass', sfields=sfld, mfields=mfld)
ds352 = {k:{'srange':(int(dsets[k][0][1:]),int(dsets[k][-1][1:]))}
			for k in dsets.keys()[1:4]}
ds352['D000bkgo'] = {'srange':(57,96)}
ds352['D000bkgc'] = {'srange':(17,56)}
_ = ds352.pop('D000')

plot_crosstalk(ds352, msc352)
dkeys = sorted(ds352.keys())
dsum = [ds352[k]['sum'] for k in dkeys]
dsum[2] = dsum[2]-dsum[1]
dsum[3] = dsum[3]-dsum[0]
dsum[4] = dsum[4]-dsum[1]

for i in range(2,5):
    sttl = ds352[dkeys[i]]['sttl']+' Bkg Subtract'
    cts = dsum[i]
    ttl = ds352[dkeys[i]]['ttl']
    plot_MS_bar(masses, cts, sttl, ttl)

cstoff = dsum[4]/dsum[3]*100
sttl = 'Crosstalk Ratio, 8.112kms, CS Off - R1020'
cts = cstoff
ttl = 'IP=1000ms, 40 scan summation, KE=0.675eV, H2 ratio={:.3f}%'.format(cts[1])
plot_MS_bar(masses, cts, sttl, ttl, yl='Percent')

cston = dsum[2]/dsum[3]*100
sttl = 'Crosstalk Ratio, 8.112kms, CS On - R1020'
cts = cston
ttl = 'IP=1000ms, 40 scan summation, KE=0.675eV, H2 ratio={:.3f}%'.format(cts[1])
plot_MS_bar(masses, cts, sttl, ttl)

#all data sets
dsAll = [ds352, ds349, ds356, ds349h2o]
dsp = [[ds[s]['sttl'], ds[s]['h2cts'].mean(), ds[s]['wcts'].mean() ]
		for ds in dsAll for s in sorted(ds.keys())]


#=================Consolidating H2/H2O leakag data============================#
# gather all datasets into one list
# iterate the list and

#H2 Thermal leakage
thermalH2Data = [ds349, ds352, ds356, ds018, ds028]

#=====================plotting SID Data for R1003============================#
dpath = inmsDataDir+'2015-272'
msSID = get_INMS_data(dpath, '*_MS_*')
mscSID = get_INMS_scan_data(msSID, id0='mass')

BKG = [0]
SID1 = range(1,8,2)
THM1 = range(2,9,2)
SID2 = range(9,16,2)
THM2 = range(10,17,2)
SID3 = range(17,25,2)
THM3 = range(18,25,2)

sid272 = {'SID1':SID1, 'THM1':THM1,
            'SID2':SID2, 'THM2':THM2,
            'SID3':SID3, 'THM3':THM3,
            'BKG':BKG}

ds272 = get_datasets(sid272)
sum_sets(ds272, mscSID)
dkeys = sorted(ds272.keys())

for k in sid272.keys():
    sid272[k] = sum(array([ds272[dkeys[i]]['sum'] for i in sid272[k]]),0)

M = mscSID[0][-1]
for k, s in sid272.iteritems():
    plot_MS_bar(M, s, k, 'R1003')

SID_1 = sid272['SID1']-sid272['THM1']
SID_2 = sid272['SID2']-sid272['THM2']
SID_3 = sid272['SID3']-sid272['THM3']

#=====================Plotting Simulted Energy Scan Data from GM=====================#
os.chdir(inmsDataDir)
simfile = glob.glob('*.dat')[0]
with open(simfile) as df:
        dlist = [item.strip('\r\n').split(',')
        			for item in df.readlines()]
simQL = array([d[0] for d in dlist], float)
simCnts = array([d[1] for d in dlist], float)
figure()
plot(simQL, simCnts/simCnts.max())
ylim(0, 1.1)
ylabel('Counts')
xlabel('QL3 Voltage')
title('Simulated Energy Scan 11.6eV CO2', fontsize=16)
draw()
savefig('Simulated Energy Scan 11.6eV CO2.png')
close()
INMS_REU_Data_Analysis.py
#------------------------------------------------------------------------#
# Title: 	INMSAngularResponseDA.py
# Purpose:  Provide tools for reading, analyzing, and plotting INMS data.
#
#------------------------------------------------------------------------#
#
# How to use this software:
# Must have Python v2.7.5 or later and IPython installed and running.
# Open the IPython interpreter - QtConsole and run the following commands
#
# cd /Users/jgrimes/Documents/Ion Gun/data or relevant user directory
# from INMS_REU_Data_Analysis import *
# ion()
#
# All required scripts and packages have now been loaded and the directory
# has been set to the data location to access files. To run methods from
# the interpreter prompt type
# ...: functionName(arg1, arg2, ..., argN)
#------------------------------------------------------------------------#

#begin import packages
#from pylab import * #all of numpy and matplotlib
from numpy import *
from scipy import *
from datetime import datetime
from datetime import timedelta
from matplotlib.pyplot import *
from matplotlib.dates import DateFormatter
from scipy.interpolate import griddata

import os
import csv
import json
import glob

inmsDataDir = '/Users/jgrimes/Documents/Cassini/INMS Data/'
formatter = DateFormatter('%H:%M')

sfld = ['run', 'dataset', 'scan', 'mode',
        'initial_time', 'final_time']

mfld = ['ip','cs_fil1_emis_iset','cs_fil1_emis_imon', 'cs_anode1_imon',
        'cs_ionrep_imon', 'os_fil1_emis_imon', 'chamber_ion_pmon']

def get_INMS_data(datapath, srchstr):

    os.chdir(datapath)
    #make a list of appropriate files
    esFiles = glob.glob(srchstr)

    #read each file in the list
    esData = {}
    for dfile in esFiles:
        esData[dfile] = read_INMS_scan_file(dfile)

    return esData

def get_INMS_scan_data(data, id0='lens_vset', sfields='', mfields=''):
#
    if sfields == '':
        sfields = ['run', 'dataset', 'scan',
                    'initial_time', 'final_time']
    if mfields == '':
        mfields = ['cs_fil1_emis_imon', 'cs_anode1_imon',
                     'cs_ionrep_imon', 'chamber_ion_pmon']
    scanData = []
    for k in sorted(data.keys()):
        try:
            scan = data[k]['Scan']
            oneScan = [scan[item] for item in sfields]
            monitors = data[k]['Monitors']
            oneScan.extend([monitors[item] for item in mfields])
            titl = data[k]['Data'][0]
            cnts = data[k]['Data'][1][:, titl.index('counter1')]
            d = data[k]['Data'][1][:, titl.index(id0)]
            oneScan.extend([cnts, d])
            scanData.append(oneScan)
        except TypeError:
            print(k)
            pass
    return scanData

#===============DA tools for INMS Mass Scan Data============================#

def get_MS_scan_times(jn_file):
    tBkg, tSID, tTherm, SIDgrps = [],[],[],[]
    dset = 1
    with open(jn_file) as jn:
        for line in jn:
            if 'Scan' in line:
                jln0, jln1 = line.strip('[').split(']')
                if 'Background' in jln1:
                    tBkg.append(jln0)
                    SIDgrps.append({'Bkg':tBkg})
                elif 'SID' in jln1:
                    tSID.append(jln0)
                elif 'Thermal' in jln1:
                    tTherm.append(jln0)
            elif 'SID measurement completed' in line:
                tEnd = line.strip('[').split(']')[0]
                SIDgrps.append({'SID':tSID, 'Therm':tTherm, 'End':tEnd})
                tSID, tTherm = [], []
    return SIDgrps

def get_datasets(msFiles):
    dsets = {}
    for msf in msFiles:
        _,_,d,s = msf.strip('.txt').split('_')[2:]
        try:
            dsets[d].append(s)
        except KeyError:
            dsets[d] = [s]
    return dsets


def scale_ms_data(data, aveP=0, avEmis=0):
    if aveP==0:
        #if no average pressure provided, calculate for this set
        aveP = array([d[8] for d in data], dtype=float).mean()

    if avEmis==0:
        #if no average emission provided, calculate for this set
        avEmis = array([d[5] for d in data], dtype=float).mean()

    numscans = len(data)
    press = array([d[8] for d in data], dtype=float)
    normP = aveP/press
    emis = array([d[5] for d in data], dtype=float)
    normE = avEmis/emis
    scans = array([d[-2] for d in data])
    scaled = [scans[i]*normP[i]*normE[i] for i in range(0, numscans)]
    return scaled

def plot_MS_bar(M, D, sttl, ttl, yl='Counts', save=False, inline=True):
    figure()
    bar(M-.5, D)
    suptitle(sttl, fontsize=16)
    gca().set_title(ttl, fontsize=12)
    xlabel('Mass per Charge')
    ylabel(yl)
    xlim(.5, 25.5)
    ylim(0, 1.05*max(D))
    draw()
    savefig(sttl+'.png')

def plot_crosstalk(dsets, mscans):
    sum_sets(dsets, mscans)
    for s in dsets:
        plot_MS_bar(s['masses'], s['sum'], s['sttl'], s['ttl'])


def get_ds_ranges(dst):
    for k in dst.keys():
        sc = sorted(dst[k])
        i, f = int(sc[0][1:]), int(sc[-1][1:])
        dst[k] = {'srange':(i,f)}


def sum_sets(dsets, mscans):
    # sum the mass scans to create one composite mass scan for the dataset
    # extract all items relevant to scale and compare mass scan data
    for s in sorted(dsets.keys()):
        i, f = dsets[s]['srange']
        scanSum = sum(array([ms[-2] for ms in mscans[i-1: f]]),0)
        h2cts = array([ms[-2][1] for ms in mscans[i-1:f]])
        wcts = array([ms[-2][14] for ms in mscans[i-1:f]])
        csEmis = array([ms[8] for ms in mscans[i-1:f]])
        osEmis = array([ms[11] for ms in mscans[i-1:f]])
        chPress = array([ms[12] for ms in mscans[i-1:f]])
        run, mode, ip = mscans[f-1][0:7:3]
        masses = mscans[f-1][-1]
        numscans = f-(i-1)

        sttl = '{} - R{}'
        if 'bkg' in s:
            sttl =  '{} Background - R{}'
        elif mode=='OSNB':
            if float(mscans[f-1][7]) >= 1:
                sttl = '{} - CS On - R{}'
            else:
                sttl = '{} - CS Off - R{}'
        sttl = sttl.format(mode, run)
        if 'v_comp' in dsets[s].keys():
            sttl = sttl + ' {}kms'.format(dsets[s]['v_comp'])

        ttl = 'IP={}ms, {} scan summation, H2counts={:.0f}'
        ttl = ttl.format(ip, numscans, scanSum[1])

        dsets[s]['sum']=scanSum
        dsets[s]['h2cts']=h2cts
        dsets[s]['wcts'] = wcts
        dsets[s]['masses'] = masses
        dsets[s]['cemis'] = csEmis
        dsets[s]['oemis'] = osEmis
        dsets[s]['chPress'] = chPress
        dsets[s]['sttl']=sttl
        dsets[s]['ttl']=ttl


def compute_stats(dsets):
    pfmat = '{:<28}: sum={:12.0f}, std={:12.2f}, var={:12.2f}'
    hfmat = '{:<28}: {:>12}{:>12}{:>12}'
    print(hfmat.format('Dataset','H2 Sum','Avg. H2','Std. Dev.', 'Variance'))
    for dk in sorted(dsets.keys()):
        if 'h2cts' in dsets[dk].keys():
            ds = dsets[dk]
            ds['h2sum'] = ds['h2cts'].sum()
            ds['mean'] = ds['h2cts'].mean()
            ds['std'] = ds['h2cts'].std()
            ds['var'] = ds['h2cts'].var()
            pp = pfmat.format(ds['sttl'],ds['h2sum'],ds['mean'],ds['std'],ds['var'])
            print(pp)


def compute_h2ratios(dsets):
    #dsets must be a specific grouping of 5 data sets including, in order,
    #CSN background, OSNB background, OSNB-filOn, CSN, and OSNB-filOff.
    if len(dsets)==5:
        skeys = sorted(dsets.keys())

        #asign the variables
        bkgc, bkgo, osnb1, csn, osnb2 = [dsets[sk] for sk in skeys]

        #subtract the background
        csnb = csn['sum'] - bkgc['sum']
        osnb1b = osnb1['sum'] - bkgo['sum']
        osnb2b = osnb2['sum'] - bkgo['sum']

        #compute the ratios for all species
        osnb1r = osnb1b/csnb
        osnb2r = osnb2b/csnb

        #compute the uncertainty
        m1, m2, mc = osnb1['mean'], osnb2['mean'], csn['mean']
        m1r = m1/mc
        m2r = m2/mc
        sig1 = (m1/mc)*sqrt((1/m1)+(1/mc))
        sig2 = (m2/mc)*sqrt((1/m2)+(1/mc))

        #attach results to appropriate data sets
        osnb1['ratio'] = m1r
        osnb1['sigma'] = sig1

        osnb2['ratio'] = m2r
        osnb2['sigma'] = sig2

        #print results
        pfmat = '\tCS{}: \tR(H2)={:.2e}, uncertainty={:.2e}'
        print('\tH2 ratio OSNB/{}'.format(csn['sttl']))
        print(pfmat.format('On', m1r, sig1))
        print(pfmat.format('Off', m2r, sig2))

    else:
        print('Compute_h2ratios requires exactly 5 data sets.')


def compute_water_ratios(dsets):
    skeys = sorted(dsets.keys())
    mh1, mhc, mh2 = [dsets[sk]['mean'] for sk in skeys[2:]]
    mw1, mwc, mw2 = [dsets[sk]['sum'][14]/40 for sk in skeys[2:]]
    mhw1, mhw2 = mh1/mw1, mh2/mw2
    sig1 = (mh1/mw1)*sqrt((1/mh1)+(1/mw1))
    sig2 = (mh2/mw2)*sqrt((1/mh2)+(1/mw2))
    sig3 = mhc/mwc*sqrt((1/mhc)+(1/mwc))
    sig4 = mh1/mwc*sqrt((1/mh1)+(1/mhc))
    sig5 = mh2/mwc*sqrt((1/mh2)+(1/mhc))
    pfmat = '\t{}: \tR({})={:.2e}, uncertainty={:.2e}'
    print('\tH2/H2O ratio OSNB v_comp = 8.506 km/s')
    print(pfmat.format('OSNB CS-On', 'H2/H2O', mhw1, sig1))
    print(pfmat.format('OSNB CS-Off', 'H2/H2O',mhw2, sig2))
    print(pfmat.format('CS Only', 'H2/H2O', mhc/mwc, sig3))
    print(pfmat.format('OSNB CS_On', 'H2(OSNB)/H2O(CSN)', mh1/mwc, sig4))
    print(pfmat.format('OSNB CS_Off', 'H2(OSNB)/H2O(CSN)', mh2/mwc, sig5))

sfld = ['run', 'dataset', 'scan', 'mode',
        'initial_time', 'final_time']

mfld = ['ip','cs_fil1_emis_iset','cs_fil1_emis_imon', 'cs_anode1_imon',
        'cs_ionrep_imon', 'os_fil1_emis_imon', 'chamber_ion_pmon']


def get_crosstalk_data(dpath):
    msd = get_INMS_data(dpath, '*_MS_*')
    msc = get_INMS_scan_data(msd, id0='mass', sfields=sfld, mfields=mfld)
    dst = get_datasets(msd)
    get_ds_ranges(dst)
    sum_sets(dst, msc)
    compute_stats(dst)

    return dst, msd, msc


#sttl = 'CSN Background - R{}'
#ttlc = 'IP=1000ms, 40 scan summation, H2counts={:.0f}'.format(cts[1])

#sttl = 'OSNB Background - R{}'
#ttlc = 'IP=1000ms, 40 scan summation, H2counts={:.0f}'.format(cts[1])

#sttl = 'OSNB - CS On - R{}'
#ttlc = 'IP=1000ms, 40 scan summation, H2counts={:.0f}'.format(cts[1])

#sttl = 'CSN - R{}'
#ttlc = 'IP=1000ms, 40 scan summation, H2counts={:.0f}'.format(cts[1])

#sttl = 'OSNB - CS Off - R{}'
#ttlc = 'IP=1000ms, 40 scan summation, H2counts={:.0f}'.format(cts[1])

#sttl = 'Crosstalk Ratio, CS On - R{}'
#ttlr = 'IP=1000ms, 40 scan summation, H2 ratio = {:.3f}'.format(cts[1])

#sttl = 'Crosstalk Ratio, CS Off - R{}'
#ttlr = 'IP=1000ms, 40 scan summation, H2 ratio = {:.3f}'.format(cts[1])


#ct352 = [{dset:'bkgc', rrange}]
Download
(142KB zipped)
| Filename | Size |
|---|---|
| INMS Source Crosstalk and H2.docx | 92 KB |
| INMS_DA_scratch.py | 5 KB |
| INMS_REU_Data_Analysis.py | 10 KB |
| OSNB CSN Crosstalk Counting Statistics.xlsx | 59 KB |